
Figures & data
Table 1. Sample historical STF incident descriptions and coding for PRM.
Table 2. Participant demographics and familiarity with field study stations (N = 37).
Table 3. Verbal data coding scheme samples (Note: Verbal data are grouped into categories of planning, experience, looking/using, passengers, and behaviour; sub-codes provide more details of participant activities).
Table 4. Exposure to risky locations for persons with reduced mobility.
Table 5. Proportion of time spent engaging in risky behaviours for persons with reduced mobility.
Table 6. Types of elements persons with reduced mobility look at while walking when not looking straight.
Table 7. Comparison of risk-taking behaviours of PRM in risky locations (Note: PRM tended to have a higher rate of engaging in risky behaviours before entering a risky location).
Table 8. Comparison of risk-taking behaviours of PRM when boarding and alighting (Note: PRM demonstrated a higher rate of risky behaviour before they boarded a train than after they alighted).
Figure 1. Frequency of individual codes within the data (Note: PRM demonstrated that their journey was dominated by getting through the station or navigating the rail network).
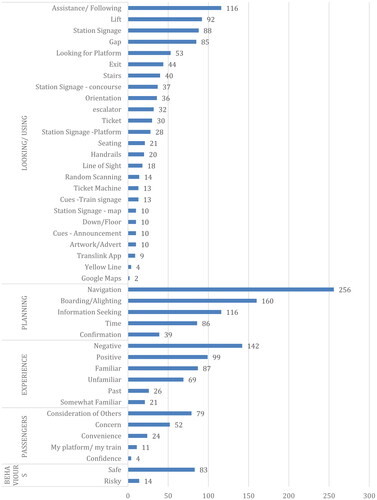
Table 9. Comparison between behaviours of PRM and those of regular passengers (Note: The differences are that the regular passengers were moving faster than normal, while PRM were spending more time next to obstacles or not looking straight ahead).
Table 10. Comparison of risk-taking behaviour of regular passengers and PRM before entering, and while in risky locations (Note: Rates of risk-taking behaviour before entering risky location were similar for PRM and regular passengers; PRM passengers had lower rate of risk-taking behaviour when in risky location).
Table 11. Comparison of risk-taking behaviour of regular passengers and PRM before boarding and after alighting from a train (Note: The regular passengers had a higher rate of risky behaviour than the PRM group).
Figure 2. Comparison of results for regular passengers and PRM (Note: Regular passengers demonstrated more planning/information seeking (14%), while PRM showed more planning/navigation (11%) during the journey.
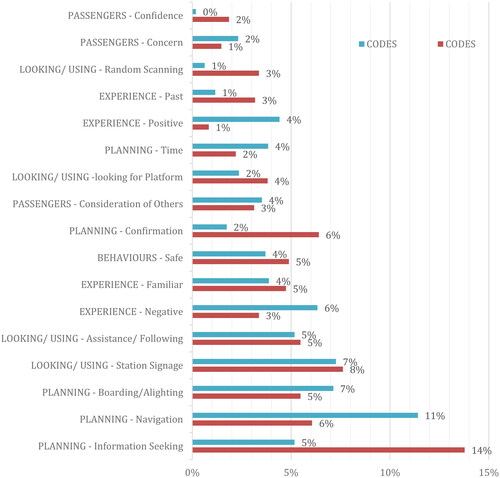
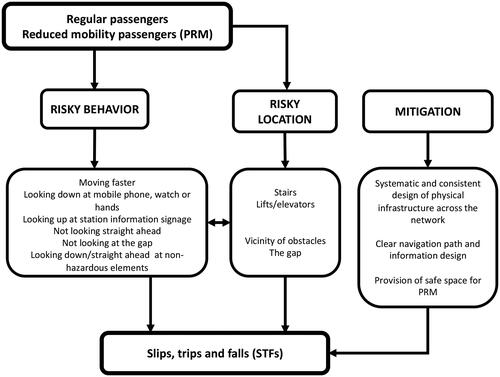
Figure 3. Conceptual model of STFs and recommended approach to mitigate their underlying factors.
Appendix A. Coding scheme for video data (Larue et al. Citation2021 updated)
Appendix B. Coding scheme for verbal data (Larue et al. Citation2021 updated)