
Figures & data
Table 1. Descriptive characteristics of the study participants.
Table 2. Spearman’s rank correlation coefficients between biomechanical exposure variables.
Figure 1. Exposure-response graphs for the association between occupational exposure to whole-body vibration and neck pain, for men and women together (A), as well as men (B) and women (C) separately.
Three separate line graphs showing varying point estimates with increasing exposure to whole-body vibration.
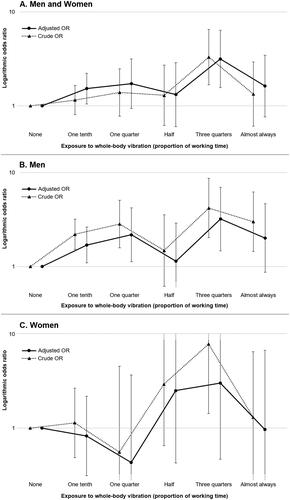
Table 3. Logistic regression for occupational exposure to whole body vibration in relation to reporting neck pain.
Table 4. Sensitivity analyses on logistic regression for occupational exposure to whole body vibration in relation to reporting neck pain (men and women).
Data availability statement
The dataset used during the current study can be made available upon reasonable request to the corresponding author.