
Figures & data
Table 1. Characteristics of functional and divisional team structures.
Table 2. Overview of the in-real-life (IRL) cases A–D and the simulated (SIM) cases 1–4.
Table 3. Participating team roles in the in-real-life (IRL) cases A–D and in the simulated (SIM) cases 1–4.
Table 4. Example of coding into a matrix for ‘all communications’.
Table 5. Example of coding into a matrix for ‘individually directed communications’.
Table 6. Transcription details from the four real (IRL) and four simulated (SIM) cases.Table Footnotea
Table 7. Nodes with the highest weighted point centrality scores of real (IRL A–D) and simulated cases (SIM 1–4) for individually directed and all communicative events.
Table A1. Description of the hospitals level one trauma statistics in regards of trauma mechanisms, age groups and severity of incoming cases.
Figure 1. Examples of social networks as examined by Leavitt (Citation1951). Black node: team leader; Grey node: team member; Black line: communication.
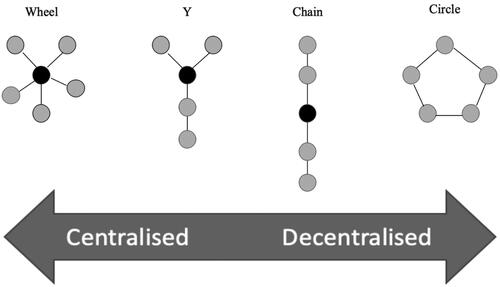
Figure 2. Density is calculated as 2M/(N(N − 1)), where N = number of nodes (circles A–E in the figure) and M = number of connections between nodes.
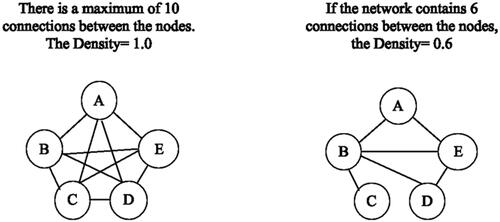
Figure 3. Density of real (IRL A–D) and simulated (SIM 1–4) cases, using all and individually directed communication. ‘All communication’ is the sum of individually directed communication and ‘talking to-the-room’.
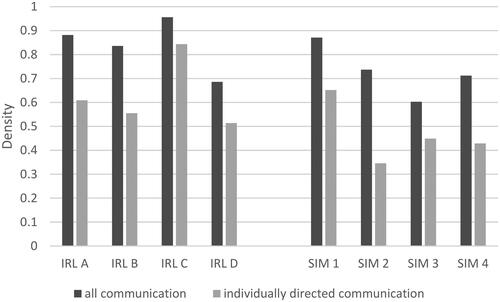
Figure 4. Average clustering of real (IRL A–D) and simulated (SIM 1–4) cases using all and individually directed communication. ‘All communication’ is the sum of individually directed communication and ‘talking to-the-room’.
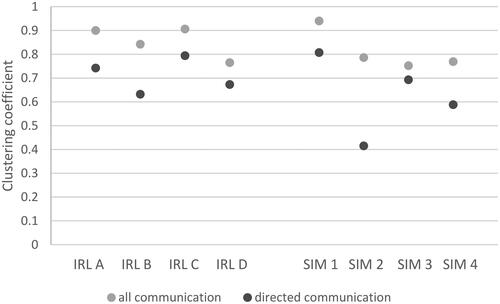
Figure 5. Overall weighted centralisation comparing all and individually directed communication for real (IRL A–D) and simulated (SIM 1–4) cases. ‘All communication’ is the sum of individually directed communication and ‘talking to-the-room’.
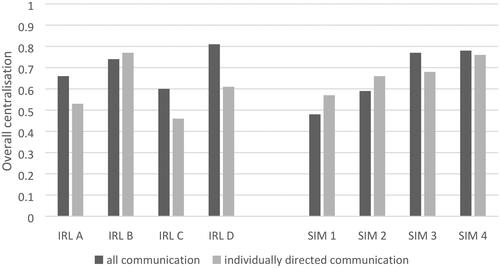
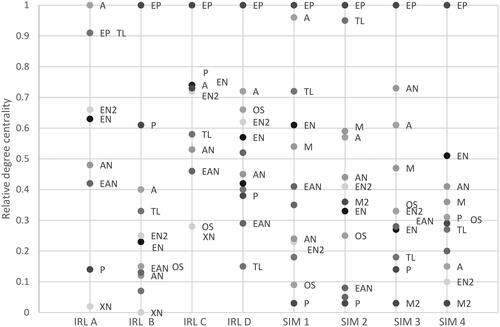
Figure 6. The relative weighted degree centralities of different team roles of the real (IRL A–D) and simulated (SIM 1–4) cases using individually directed communication. EP: examining physician; A: anaesthesiologist; TL: team leader; EN: emergency room nurse; EN2: emergency room nurse 2; AN: airway nurse; EAN: assistant nurse; P: patient; OS: orthopaedic surgeon; DN: documenting nurse; EAN2: assistant nurse 2; XN: radiology nurse; M: instructor; A2: anaesthesiologist 2; M2: instructor 2.
Data availability statement
Data sharing of original videos is not possible as they are sensitive in nature. The datasets supporting the conclusions of this article are available in this article and its Supplementary Files.