
Figures & data
Table 1. Literature review.
Table 2. Attributes and levels.
Figure 1. Example of stated choice experiment with choice task.
Figure shows an example of a choice task, in which people should indicate their preferred office scenario (A or B). If they do not have a preference, they can select the ‘no preference’ option.
The figure shows an example of a choice task, in which people should choose in which office scenario (A or B) they expect to work most productively and concentrated, feel least stressed, and most relaxed and happy. If they cannot make a choice, they can choose the ‘no preference’ button.
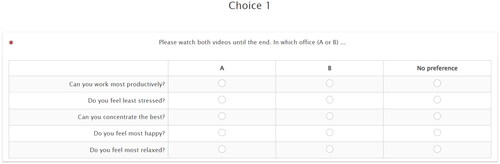
Figure 2. (a) Screenshot of video at start of alternative 23; (b) at 5 s; (c) at 10 s; (d) at 20 s.
Screenshots a to d show the virtual office design of alternative 23, with white walls, several desks with desktops and people sitting behind the desk, and four windows with a city view.
(a) Shows the start position of the virtual office design of alternative 23. It includes white walls, white cabins at the left, and a glass door at the right side, (b) shows a screenshot of the virtual office design at 5 s, with several desks with people, and two windows with a city view, (c) shows a screenshot at 10 s, with desks with desktops and people sitting behind the desks, and four windows with a city view, and (d) shows a screenshot at 20 s (the end of the movie), including several desks with desktops and people sitting behind the desks.
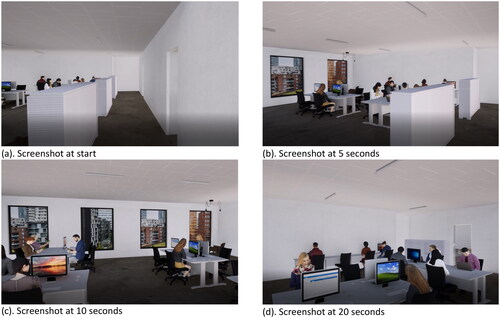
Table 3. Sample description.
Table 4. Goodness of fit statistics.
Figure 3. Relative importance of workspace attributes per psychological or cognitive response.
Bars of different heights, showing the relative importance of each workspace attribute on a scale from 0 to 50%, indicated per psychological or cognitive response. For each response, a different grey colour has been used. A higher bar indicates a higher relative importance.
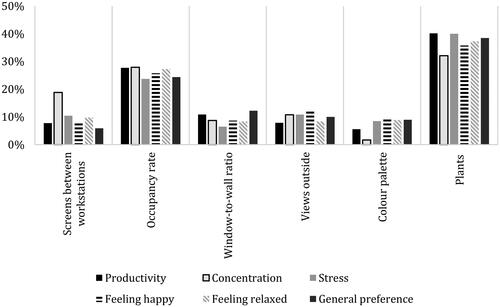
Figure 4. Utility values (β) for each attribute per psychological and cognitive response, relative to baseline level.
Bars with different heights, indicating the utility value for each attribute per psychological and cognitive response relative to a baseline level, on a scale from −3 to 3. A bar between 0 and −3 indicates a negative effect on the response relative to the base, and a bar between 0 and 3 indicates a positive effect on the response. Note: a indicates insignificant effect, negative effect on stress indicates expectations of increased stress.
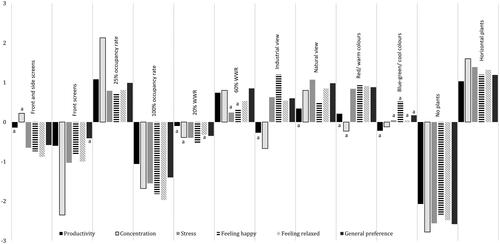
Table 5. Mixed multinomial logit model.