
Figures & data
Figure 1. The image on the left shows a multi-component training exercise at the Lancashire Fire and Rescue Service Training Centre. This training building consists of steel shipping containers and during the training exercise the firefighters move through the structure which has been set alight in a controlled manner. Firefighters not undertaking the training monitor the situation at all times. The right-hand image shows personal protective equipment and breathing apparatus worn during the live-fire training.
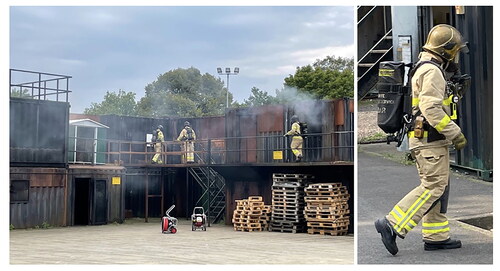
Figure 2. A timeline of activities completed by the participants showing the full experimental procedure.
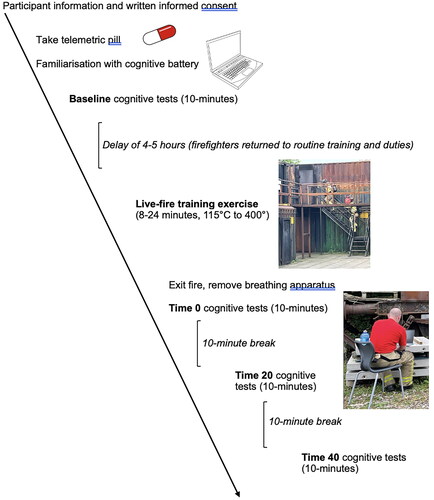
Table 1. Mean (M) and standard deviation (SD), and median (Mdn) and interquartile range (IQR) of core body temperature and performance in the n-back, SART, and WCST across the four time points. *Indicates temperatures On Entry to fire training exercise rather than at time of Baseline cognitive tests.
Figure 3. A box plot to show core body temperature (from 26 participants) across the four timepoints. Boxes extend from the 25th to the 75th percentile of the distribution of values within each condition, the horizontal black line across each box is the median value, and the vertical extending black lines represent the minimum and maximum values in each condition. The black triangles denote the mean. Temperature increased significantly post live-fire training exercise and returned to On Entry levels after 20-minutes (*indicates a significant difference).
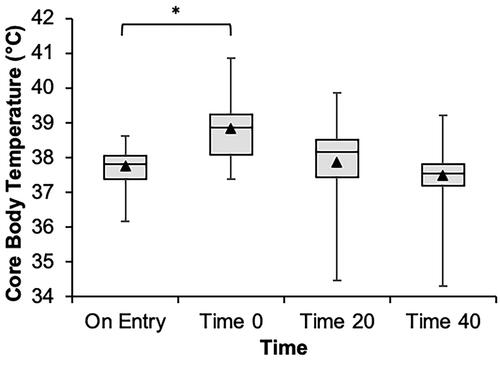
Figure 4. Box plots to show performance in the SART across the four timepoints. Boxes represent interquartile range with the median shown as a horizontal black line across each box. The vertical extending black lines show the minimum and maximum values in each condition and mean values are denoted by a black triangle (*indicates a significant difference). Results show no effect of heat on omission errors (a) but impaired performance at Time 0 for the number of commission errors (b), and response times (c).
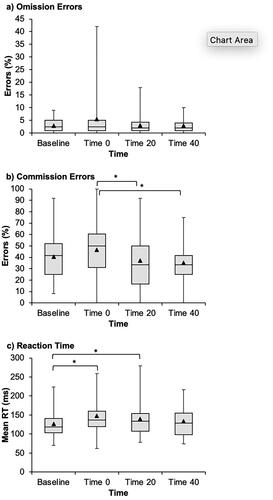
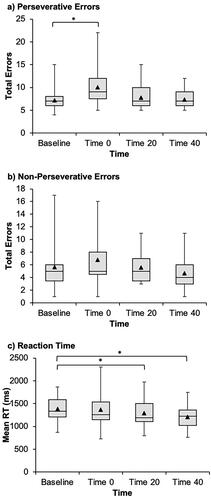
Figure 5. Box plots to show perseverative errors (a), non-perseverative errors (b), and reaction times to correct trials (c) in the WCST. Boxes represent the interquartile range, and the median is shown using a horizontal black line across each box. Minimum and maximum values are indicated by the vertical extending black lines, and black triangles represent mean values. The data suggest more perseverative errors at Time 0 and slower response times (*indicates a significant difference). The impairment may be partially masked by a practice effect leading to poorer performance at Baseline.
Data availability statement
Data are available at the project’s Open Science Framework page (https://osf.io/e49c6/?view_only=43a95d2248694a56b15474476b22a5ba).