
Figures & data
Figure 1. SCBA utilised in study. Arrows indicate where additional weight was added for SCBA2 and SCBA3. One sandbag (0.45 kg each, 2.3 kg total) was added at each location for SCBA2 and two sandbags (0.9 kg, 4.5 kg total) were added at each location for SCBA3.
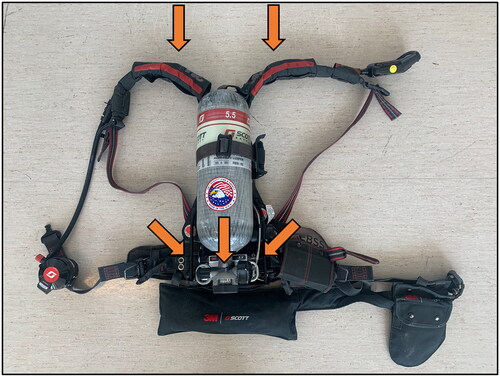
Table 1. SCBA utilised in the study included the maximum allowable weight under NFPA 1981 (16 kg), the maximal weight plus 2.3 kg (18.3 kg), and the maximal weight plus 4.5 kg (20.5 kg).
Figure 2. Schematic of firefighting test session. Heart rate and core temperature were recorded throughout the visit. Oxygen consumption was recorded throughout the firefighting activities. The Functional Balance Test was conducted pre- and post-firefighting activity. Perceptions of Thermal Sensation, Breathing Scale, and Rating of Perceived Exertion (RPE) were collected pre-, mid-, and post-firefighting activity. Visual Analog Scales (VAS) of comfort, mobility, fatigue, and subjective difficulty were collected at the end of the trial.
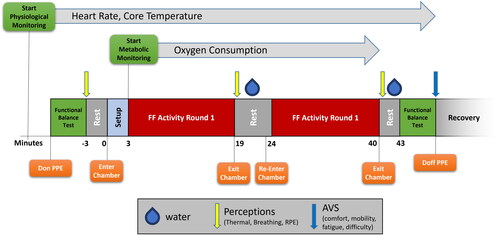
Figure 3. Participants wore a custom harness to support the metabolic monitoring system under the turnout gear (A). The participant also wore standard firefighting personal protective equipment including a coat, pants, boots, nomex hood, helmet and SCBA (B and C).
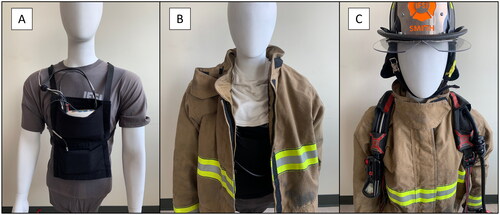
Figure 4. Participants wore the silicone K4b2 metabolic monitor mask under the hood and helmet during firefighting activities.
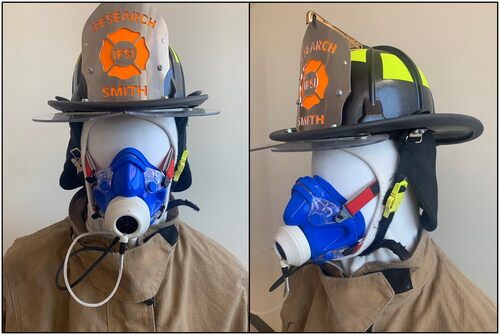
Figure 5. Schematic of firefighting activity timeline. Activities were completed on a 2-minute work/rest cycle.
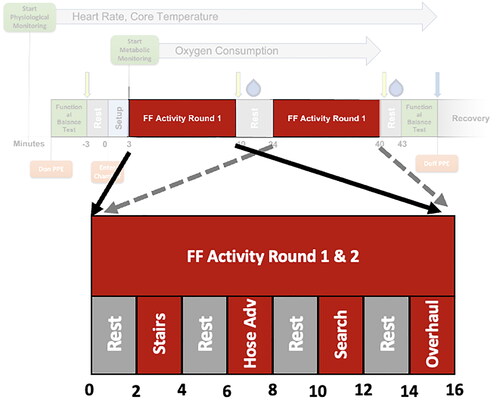
Table 2. Heart rate and activity data for each bout of activity with three different SCBA weights. Heart rate data include peak heart rate across the activities (HRPeak) and peak heart rate as a percent of maximum heart rate (HRPeak % of HRmax). (‡) indicates Bout 2 is significantly different than data from Bout 1. Data are shown as mean (standard deviation).
Table 3. Peak values and post-firefighting assessment after completing simulated firefighting activities with three different SCBA weights for Work Time, peak rate of oxygen consumption (VO2Peak), peak rate of oxygen consumption as a percent of maximal rate of oxygen consumption (VO2peak % of VO2max), core temperature rate of rise (Tco,RoR), and visual analog scales of Comfort, Mobility, Fatigue, and Subjective Difficulty (scored -8 to +8). Superscripts (i.e. 1,2,3) indicate significant differences from SCBA noted in superscript. Data are shown as mean (standard deviation).
Table 4. Perceptions pre- and post- firefighting activity by SCBA. (✢) Indicates significantly different from Pre. Data are shown as mean (standard deviation). Post hoc analysis revealed no significant differences for interaction effects.
Table 5. Performance Index (PI) by SCBA and PrePost without and with the crossbar present. (✢) Indicates significantly different from Pre. Data are shown as mean (standard deviation).