
Figures & data
Exhibit 1. Literature in Capacities of Factor Investing
Table 1. Distribution of Asset Levels on Rebalancing Dates of the Underlying Indexes, 1968–2016
Table 2. Distribution of Relative Trade Size
Source: Research Affiliates, based on data from Bloomberg.
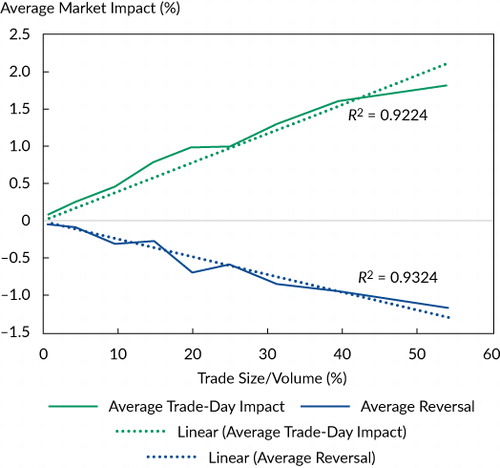
Note: Market impact factors are in percent, estimated by Equation 2.
Source: Research Affiliates, LLC, using data from Bloomberg.
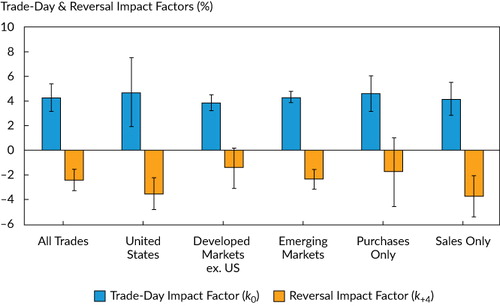
Table 3. Estimates and Significance of Trade-Day and Reversal Impact Factors
Table 4. Market Impact Costs and Liquidity Characteristics of US Factor-Investing Strategies, 1968–2016
Supplemental material