Figures & data
Table 1. Five “Outsiders” in XLV: Stocks in the Bottom 10% of ETF Betas
Exhibit 1. ETF Symbols and Names
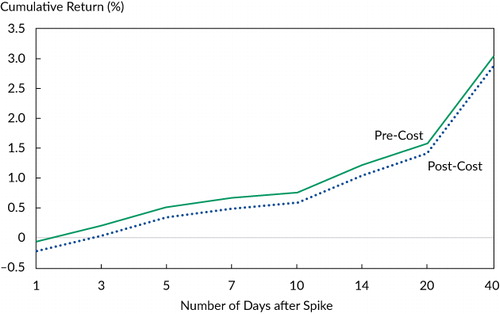
Notes: Data are as of 29 December 2017. Transaction costs are estimated at 10 bps, or 17 bps considering leverage, on average. Borrowing costs are based on LIBOR and depend on how long the position is held. They cumulate to about 10 bps, on average, after 40 days. Hence, a rough estimate of total costs (transaction and borrowing) for 40 days would be 27 bps.
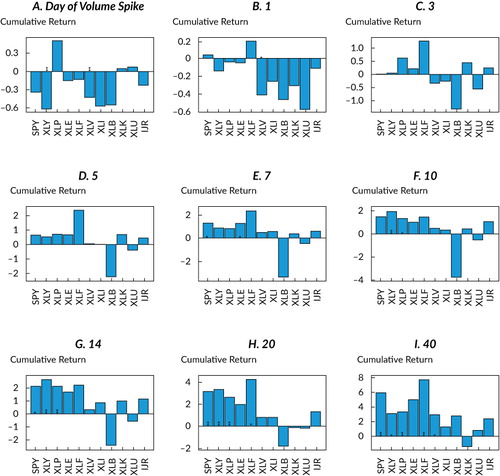
Notes: Data are as of 29 December 2017. Transaction costs are estimated at 10 bps, or 17 bps considering leverage, on average. Borrowing costs are based on LIBOR + 50 bps and depend on how long the position is held. They cumulate to about 10 bps, on average, after 40 days. Hence, a rough estimate of total costs (transaction and borrowing) for 40 days would be 27 bps. The Wilcoxon signed-rank test (see the online supplemental material, available at www.tandfonline.com/doi/suppl/10.1080/0015198X.2019.1572358, for details) indicates significance levels of 0.05* and 0.01**. Some returns are positive on Day 0 because they are measured relative to the ETF.