Figures & data
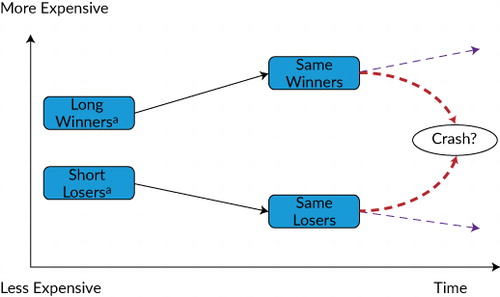
aWinners are not formulaically more expensive than losers, even though they have generally been so historically.
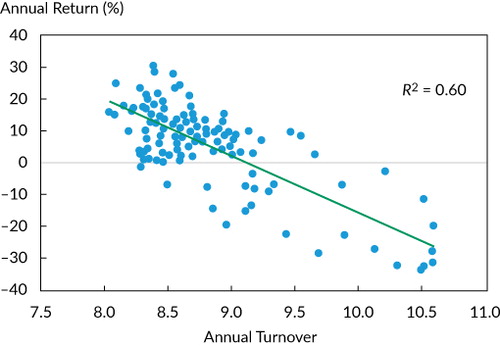
Notes: This figure shows annual turnover of an equity momentum strategy (top versus bottom decile) and its rolling one-year performance. The strategy is a combination of three quarterly rebalanced strategies that rebalanced in different months of a quarter. The universe is a global developed market equity universe.
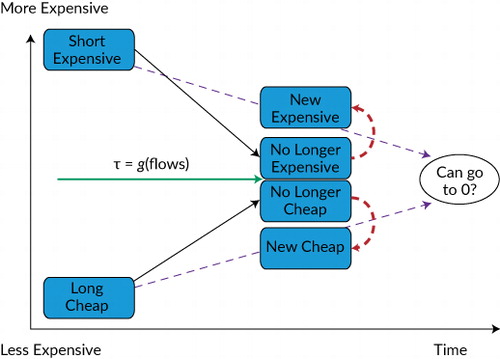
Note: τ denotes the time to convergence of the valuation spread and is a function of investor flows.
Notes: This figure shows the annual turnover of an equity value strategy (cheap versus expensive decile) and its rolling one-year performance. The strategy is a combination of three quarterly rebalance strategies that rebalanced in different months of a quarter. The universe is a global developed market equity universe.
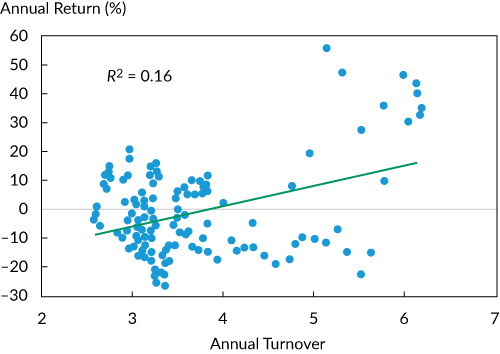
Table 1. Overview of Asset Class Data and Strategies
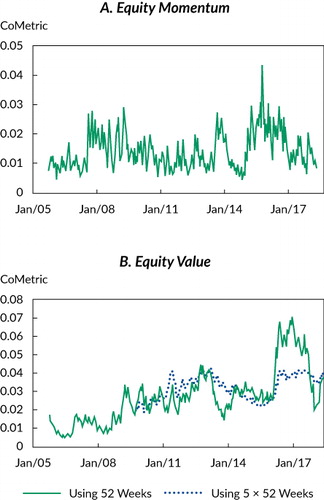
Notes: The figure presents the average pairwise excess correlation for the winners and losers (Panel A) and for the cheap and expensive stocks (Panel B) of a global equities universe. The estimation is weekly, and the past 52 weekly returns (or 5 × 52 weekly returns for value) of each stock were used for the estimation. The returns of the assets in the momentum (value) baskets are factor adjusted for the market, size, and value (momentum) factors. The sample period is September 2004 (first estimates become available 52 or 5 × 52 weeks later, accordingly) to May 2018.
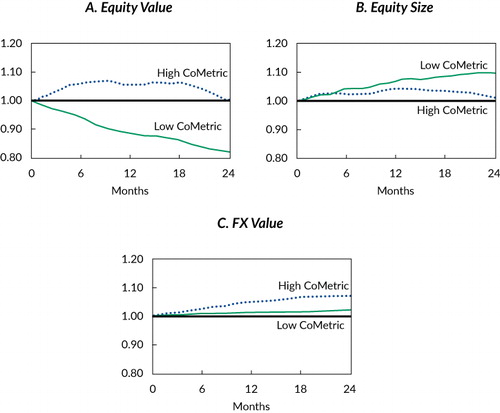
Notes: This figure shows average buy-and-hold performance of a long–short equity momentum portfolio (top minus bottom equally weighted deciles) over a two-year period following the most crowded periods or the least crowded periods. Crowdedness was measured on a weekly basis. The figure contains 95% confidence interval bands estimated using Newey–West (1987) standard errors. The sample period for determining the most and least crowded periods is October 2005–May 2018.
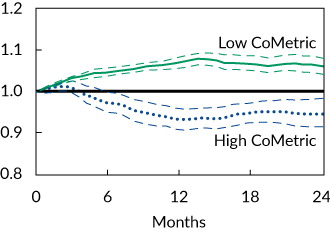
Table 2. Performance of Divergence Premia Conditional on the Level of Asset Excess Comovement
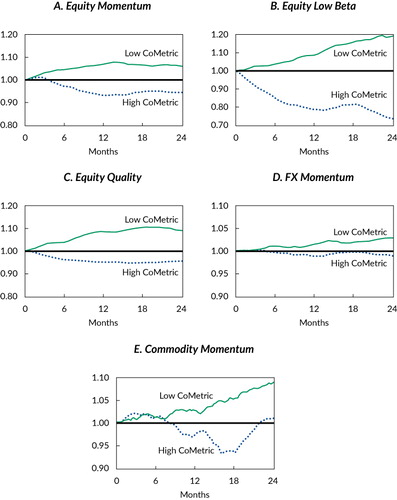
Notes: This figure shows average buy-and-hold performance of various long–short divergence portfolios (see for specification details) over a two-year period following the most crowded periods or the least crowded periods. Crowdedness was measured on a weekly basis.
Notes: This figure shows average buy-and-hold performance of a long–short equity value portfolio (top minus bottom equally weighted deciles) over a two-year period following the most crowded periods or the least crowded periods. Crowdedness was measured on a weekly basis. The figure contains 95% confidence interval bands estimated using Newey–West (1987) standard errors. The sample period for determining the most and least crowded periods is October 2009–May 2018.
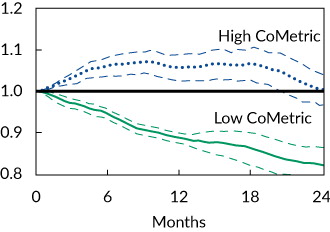
Table 3. Performance of Convergence Premia Conditional on the Level of Asset Excess Comovement
Notes: This figure shows the average buy-and-hold performance of various long–short convergence portfolios (see for specification details) over a two-year period following the most crowded periods or the least crowded periods. Crowdedness was measured on a weekly basis.