12,092
Views
4
CrossRef citations to date
0
Altmetric
Articles

The Tax Benefits of Separating Alpha from Beta

ORCID Icon, ORCID Icon, ORCID Icon & ORCID Icon

Figures & data

Figure 1. Relationship between Performance of Long-Only and Composite Long–Short Strategies

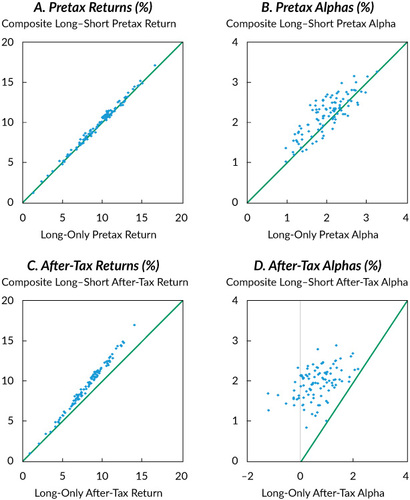
Table 1. Distribution of Pretax and After-Tax Returns and Alphas across Simulations

Figure 2. Relationship between Pretax Returns and Tax Costs
Figure 3. Relationship between Turnover and Alpha

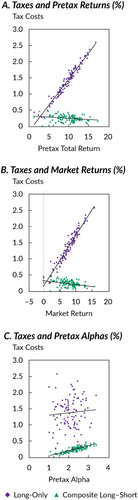
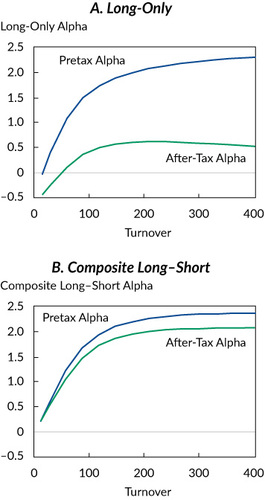
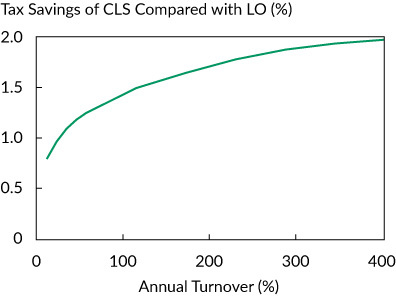
Table 2. Performance at Various Turnover Levels

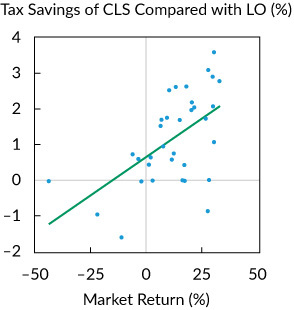
Table 3. Taxes at Different Average Market Return Levels

Table 4. Performance at Various Factor Return Levels

Table 5. Tax Benefits in Different Tax Rate Scenarios

Table 6. Tax Consequences of Manager Termination at Various Horizons

Figure 4. Average Simulated Cumulative Portfolio Values with Liquidation

Table 7. Performance Net of Fees, Trading Costs, and Financing Costs

Table 8. Performance of Tax-Agnostic and Tax-Aware Strategies in Historical Simulations, 1985–2018

Table 9. Tax Benefits in Various Tax Scenarios in Historical Simulations, 1985–2018

Figure 5. Relationship between Market Return and Tax Savings for the CLS Strategy Compared with the LO Strategy in Historical Data Simulations, 1985– 2018
Figure 6. Relationship between Annual Turnover and Tax Savings for the CLS Strategy Compared with the LO Strategy in Historical Data Simulations, 1985–2018