Figures & data
Sources: US Census Bureau’s International Data Base and author’s calculation.
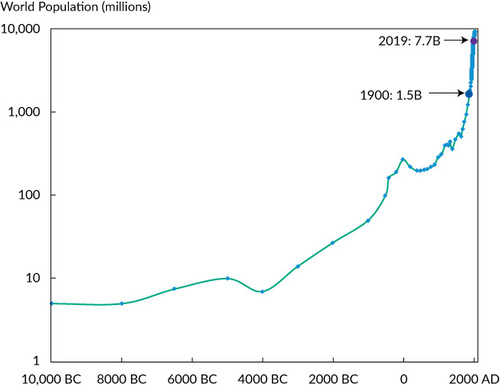


Exhibit 1. Timeline of Eight Eras of Financial Evolution from 1944 to 2021 and Key Technology, Financial, and Regulatory Milestones during Those Eras
Exhibit 2. Top 20 Authors and Words in the Titles of All Articles Published in the Financial Analysts Journal within Each of Eight Distinct Eras from 1945 to 2021

Source: FRED® Graphs ©Federal Reserve Bank of St. Louis. Effective Federal Funds Rate [FF], retrieved from FRED 8 May 2021. All rights reserved. All FRED® Graphs appear courtesy of Federal Reserve Bank of St. Louis. https://fred.stlouisfed.org/.
![Figure 5. Effective Federal Funds Rate, 1 July 1954–6 May 2021Source: FRED® Graphs ©Federal Reserve Bank of St. Louis. Effective Federal Funds Rate [FF], retrieved from FRED 8 May 2021. All rights reserved. All FRED® Graphs appear courtesy of Federal Reserve Bank of St. Louis. https://fred.stlouisfed.org/.](/cms/asset/64e94c4d-09e2-475b-a49a-8b7b4b92e66b/ufaj_a_1929030_f0005_c.jpg)
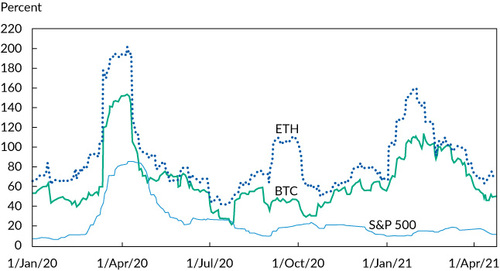
Source: www.coindesk.com/bitcoin-volatility-pattern (accessed 8 May 2021).