
Figures & data
Figure 1. A Simplified Comparison between Scope 3 Emissions and Downstream Supply Chain Climate Exposure
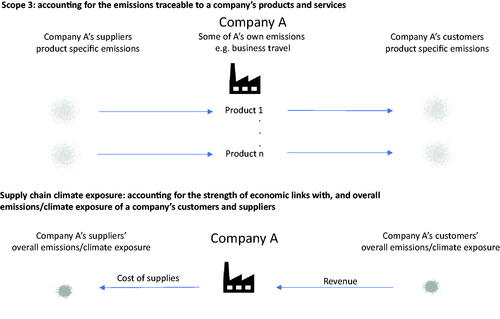
Table 1. Computing Downstream Supply Chain Climate Exposure for a Hypothetical Company, i, with Four Customers, j = A, B, C, and D
Figure 2. Carbon Emissions Statistics over Time
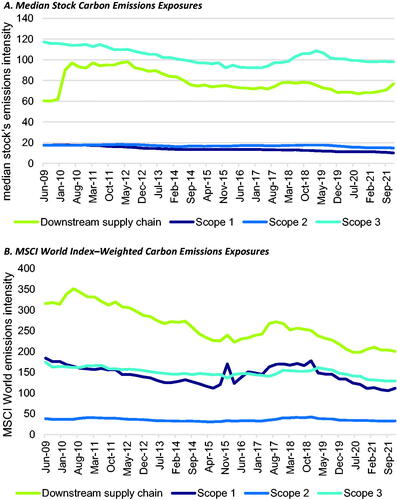
Figure 3. Sector- and Country-Level Contributions to MSCI World Index–Level Carbon Emissions Metrics
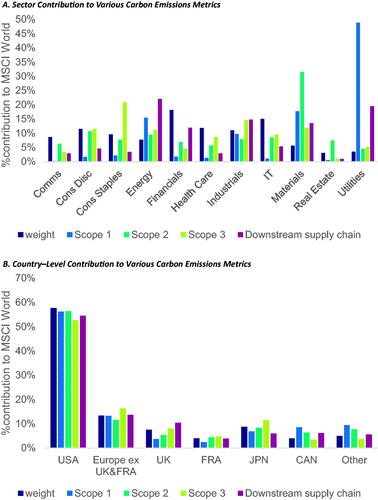
Table 2. Explaining Downstream Supply Chain Carbon Exposure with Traditional Climate Data
Figure 4. Correlation of Market-Wide Climate Sentiment with Factors Built Using Downstream Supply Chain Carbon Exposure
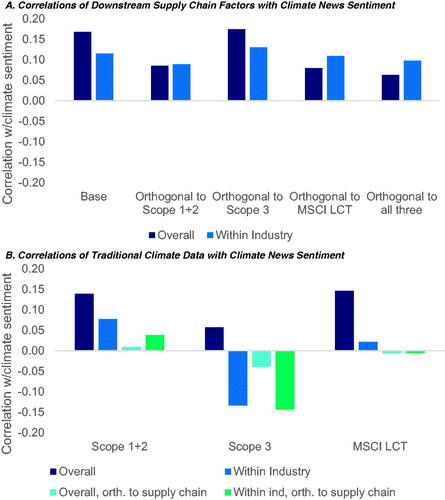
Figure 5. Stock Reaction to Climate News Events
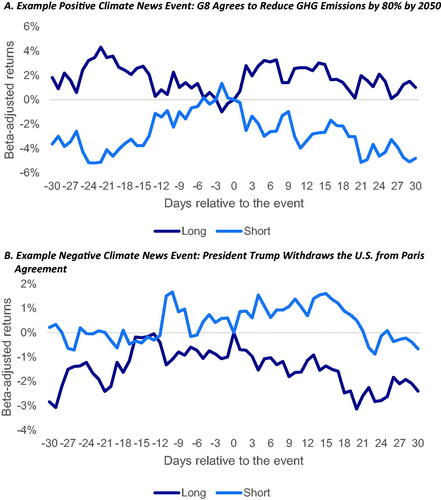
Table 3. Portfolio Performance for Longshort Portfolios Based on Downstream Supply Chain Climate Exposure
Table 4. Factor-Adjusted Performance of Downstream Supply Chain Climate Exposure (DSChCE) Long-Short Portfolios
Table 5. Regressions Relating Quarterly EPS and Sales Surprises to Downstream Supply Chain Climate Exposure