10,929
Views
1
CrossRef citations to date
0
Altmetric
Research

Targeting Macroeconomic Exposures in Equity Portfolios: A Firm-Level Measurement Approach for Out-of-Sample Robustness

Pages 37-57 | Received 08 Mar 2022, Accepted 11 Nov 2022, Published online: 13 Dec 2022

Figures & data

Figure 1. Innovations in Macro Variables Are Different from Levels: The Case of Breakeven Inflation

Figure 1. Innovations in Macro Variables Are Different from Levels: The Case of Breakeven Inflation

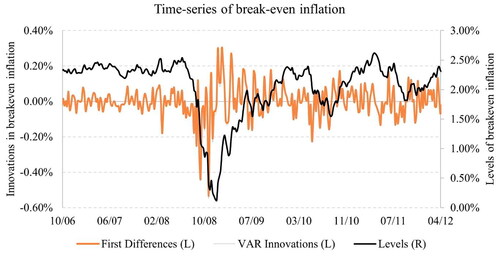
Table 1. Out-of-Sample Exposures of Mimicking Portfolios to Backward-Looking Variables

Table 2. Reliability of Macro Beta Estimates Using Different Regression Specifications: Out-of-Sample Betas with Targeted Macro Variables

Figure 2. Relation between Returns on Macro Mimicking Portfolios and Macro Variables

Figure 2. Relation between Returns on Macro Mimicking Portfolios and Macro Variables

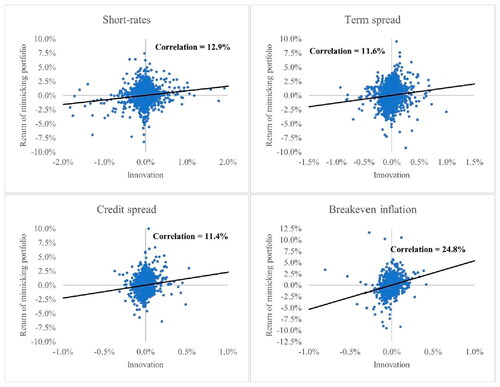
Table 3. Realised Macro Exposures of Different Equity Macro Strategies

Figure 3. Percentage of Stocks with Statistically Significant Macro Exposures across Time

Figure 3. Percentage of Stocks with Statistically Significant Macro Exposures across Time

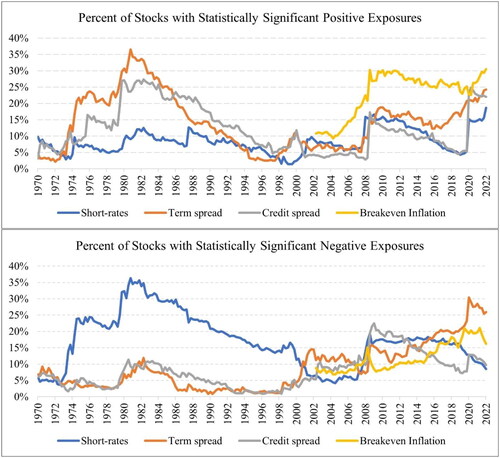
Table 4. Reliability of Macro Beta Estimates Using an Alternative Method to Form Mimicking Portfolios

Table 5. Ex-Ante and Realised Exposures of Equity-Style Factors

Figure 4. Conditional Relative Performance of Macro Dedicated Portfolios

The plot shows average annualised returns of macro dedicated portfolios after adjusting for their market exposure (CAPM beta). The analysis was done from 19 June 1970 to 30 June 2022 for all portfolios, except for the inflation portfolios, for which the analysis starts on 31 March 2002. Positive (negative) surprise periods are defined as calendar weeks (Friday to Friday) when the change in a given macro variable was amongst the top (bottom) 25% of historical observations. Returns that are statistically significant at a 5% level are presented in bars with solid fill, whilst returns that are not statistically significant at 5% are presented in bars filled with diagonal stripes.
Figure 4. Conditional Relative Performance of Macro Dedicated Portfolios

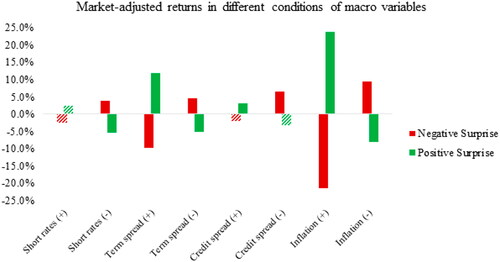
Table 6. Unconditional Performance of Macro Dedicated Portfolios

Table 7. Unconditional Performance of Inflation Targeting Portfolios

Table 8. Factor Exposure Analysis of Macro Dedicated Portfolios

Table 9. Performance of Macro Dedicated Portfolios Net of Transaction Costs

Table 10. Performance of Inflation Portfolios Net of Transaction Costs

Supplemental material

Supplemental Material

Download PDF (610.4 KB)