
Figures & data
Table 1. Comparing Costless and Costed Factor Benchmarks for QR1000 IS 100%
Table 2. Percentage Coverage by Industry for QR1000 Using NS (Panel A) and IS (Panel B) by GICS
Figure 1. TE for EW Factor Using IS, NS, and LP with QR1000
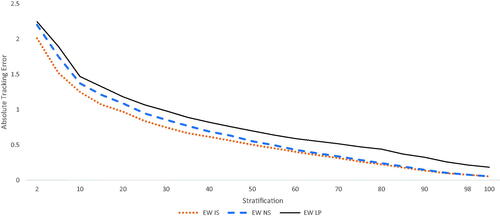
Table 3. Monthly Index Tracking Error (TE, ΔTE) between IS and NS Portfolios for the QR1000 Market Capitalized Ranking
Figure 2. ΔTE for All Factors with QR1000
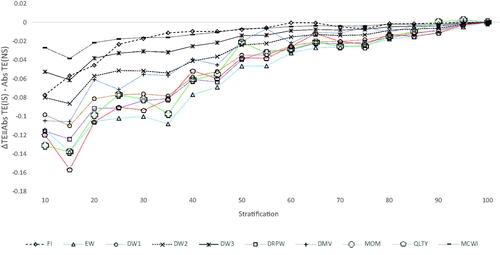
Figure 3. ΔICI for All Factors with QR1000
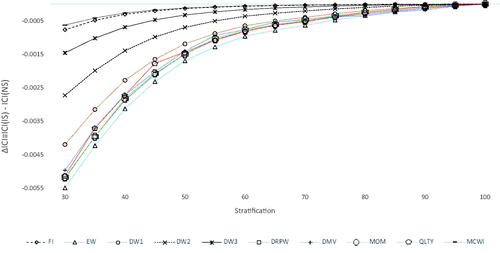
Table 4. QR1000 EW and LP Factor DMRS Regression
Figure 4. ΔAnnual Turnover and ΔEroded Value for All Factors
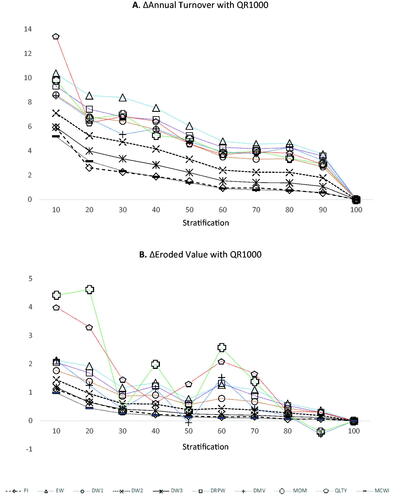
Table 5. QR1000 Dollar Ending Value ($) for EW Factor IS, NS, and LP by Stratification Percentage for Costless and Costed Portfolios
Table 6. QR1000 Economic Significance ($millions) between IS and NS Portfolios