
Figures & data
Figure 1. Global Overview of Engagements
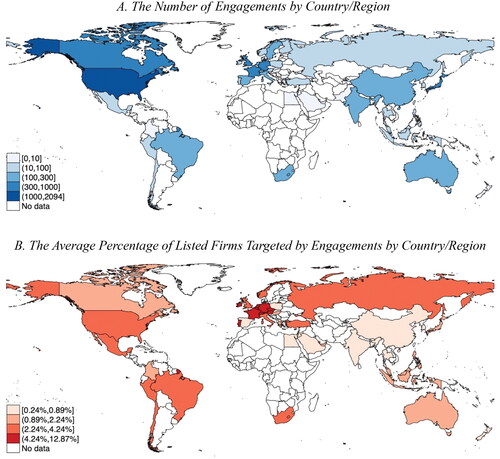
Figure 2. The Number of Engagements and the Materiality of Engagements by Topic over Time
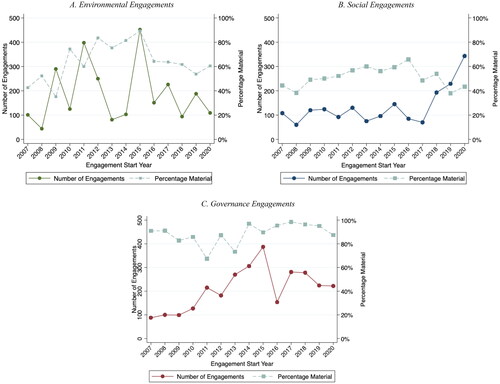
Figure 3. Cumulative Abnormal Returns after Engagements
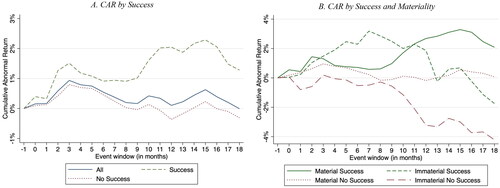
Figure 4. Average or Estimated CO2e Emissions and CO2e Intensity before and after Engagement
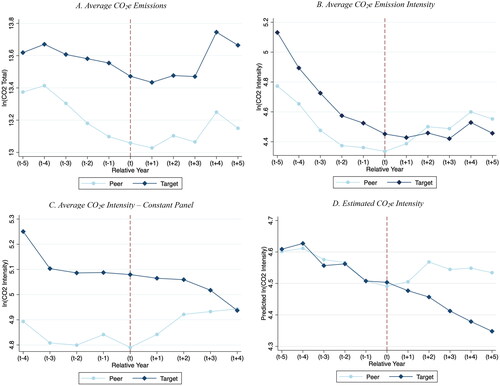
Table 1. Engagement Success by Topic and Materiality
Table 2. Engagement Success by Year, Industry, and Characteristics
Table 3. Engagement Success, Topics, Duration, and Characteristics by Quartiles of Client Ownership
Table 4. The Determinants of Success
Table 5. Average Cumulative Abnormal Returns after Engagement
Table 6. The Effect of Being Targeted by an (Im)Material Engagement on Subsequent Firm Accounting Performance
Table 7. The Effect of Being Targeted on MSCI ESG Scores
Table 8. The Effect of Being Targeted by an Environmental Engagement on Corporate Emissions
Table 9. The Effect of Being Targeted by an Emission Engagement on Corporate Emissions