
Figures & data
Table 1. Daily Value-Weighted Market Rates of Return, Post 1962/07/03, 15,479 Days
Figure 1. Z Scores for Daily Market Rates of Return
Note. Explanations: The blue line is the Z score that best matches the empirical probability for the value-weighted market rate of return when using the normal distribution tables, beginning in 1962. It is the same case as that in . The red line is the same for the equal-weighted market rate of return, beginning in 1973. The thick black line is the quick-and-dirty adjustment-heuristic of  The diagonal straight line on the right is the unadjusted Z score. Interpretation: The heuristic formula can be recommended for all negative Z scores, even though it is less conservative between −0.2 and −1.9. (For these Z scores, the difference between the adjusted and unadjusted Z score is modest, and the adjusted Z’ fits the empirical return distribution better than Z.) For Z scores lower than, say, −13, an extra further adjustment could be wise—although such events are so rare, and thus difficult to assess in the empirical stock return distribution, that this may not even be the case.) Source: data/plotusethis.R: 2024/04/16 and CRSP.
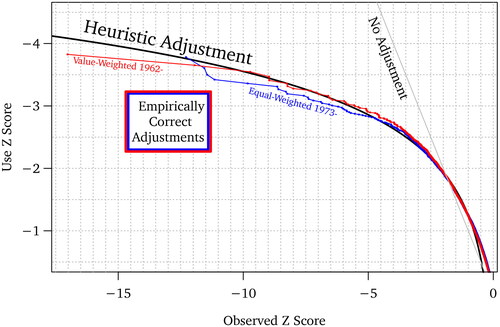
Table 2. Daily Value-Weighted Market Rate of Return, Later Starts
Table 3. Empirically Estimated Kurtosis and Student T Degrees of Freedom
Table 4. Monthly Value-Weighted Market Rate of Return, 1998, 312 Months
Table 5. Extreme CRSP Size Decile Rates of Return, Post 1973, 12,861 Days
Table 6. Fama–French Daily Factors, Post 1973
Table 7. Individual Stocks
Table A1. Well-Fitting Formula on Z Scores Below −3
Supplemental material