Figures & data
Figure 1. Location of Cenlle in the Ribeiro region of northern Spain.
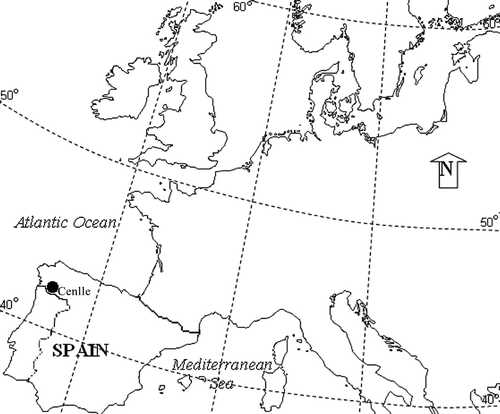
Table I. Start date, length (days), maximum daily value of Botrytis cinerea spores (spores/m3) and the date of the maximum value of the phenological grapevine principal BBCH growth stages (0 – sprouting; 1 – leaf development; 5 – inflorescence emergence; 6 – flowering; 7 – development of fruits; 8 – ripening of berries) during the years studied. The length average of the stages, the average of the total B. cinerea spores registered in each stage and the total spores registered in each year during the period 2004–2008 are also displayed
Figure 2. Spore concentrations of Botrytis cinerea during the vegetative cycle stages (0 – sprouting; 1 – leaf development; 5 – inflorescence emergence; 6 – flowering; 7 – development of fruits; 8 – ripening of berries) of the grapevine in the studied period. The grey line represents maximum temperature, and rainfall is represented by black bars.
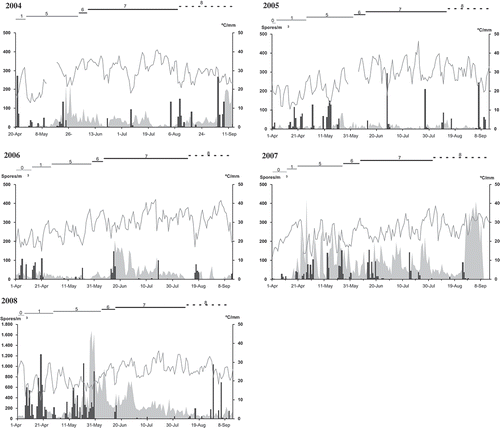
Figure 3. Total spore values of Botrytis cinerea during the vegetative cycle stages (0 – sprouting; 1 – leaf development; 5 – inflorescence emergence; 6 – flowering; 7 – development of fruits; 8 – ripening of berries) of the grapevine in the studied period.
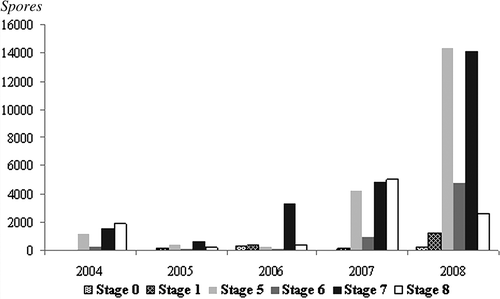
Table II. Correlation between the spore concentrations in the study period and the principal meteorological variables applying Spearman's test (p ≤ 0.01∗∗∗ highly significant; p ≤ 0.05∗∗ very significant). Values of the seven previous days were also considered
Table III. Time series of the proposed ARIMA model
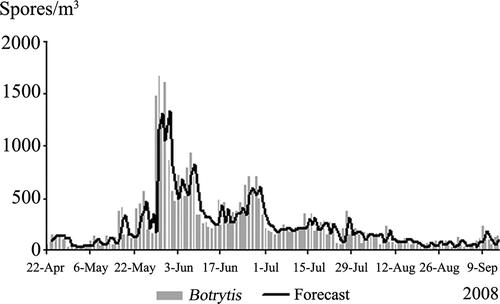
Figure 4. Daily mean Botrytis cinerea spore concentration observed and predicted during the year 2008 (which has not been included to develop the model) testing the proposed ARIMA model.