Figures & data
Table 1. Experiment 1 design.
Table 2. Mean agreement scores and standard deviations (SD) across speech acts, stakes, and speaker awareness.
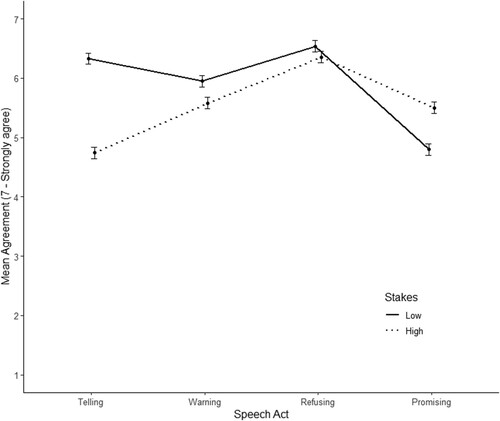
Figure 1. Mean agreement scores across speech acts, stakes, and group. Error bars represent +/− 1 standard error.
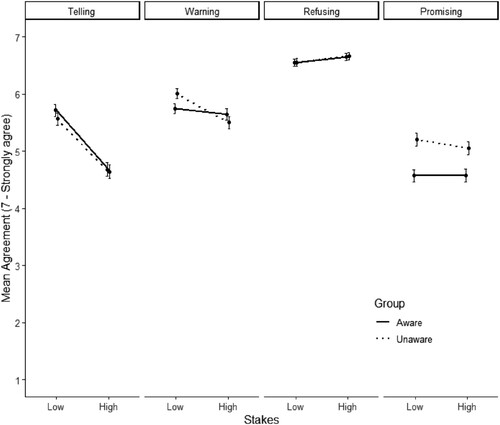
Figure 2. Line graph showing the interaction effect between stakes and speech act. There were stakes effects across all cases apart from the promising cases. Error bars represent +/− 1 SE.
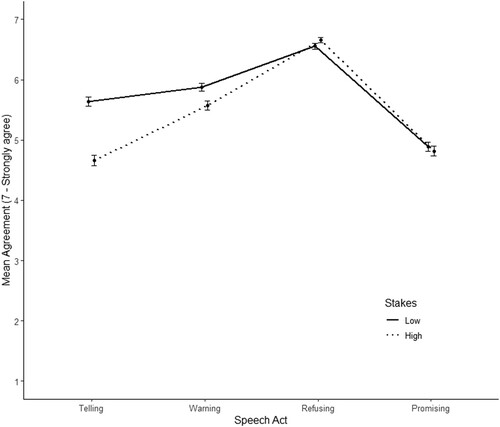
Figure 3. Line graph showing the interaction effect between group and speech act. The only statistically significant difference between group is in the promising cases. Error bars represent +/− 1 SE.
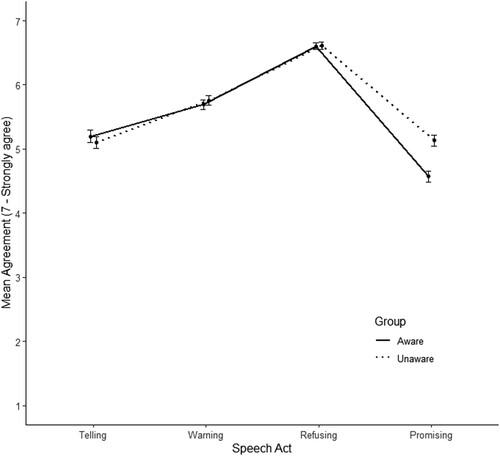
Figure 4. Line graph showing the interaction effect between stakes and speech act when only first responses were analysed. The only statistically significant differences between stakes level are in the telling and promising cases. Error bars represent +/− 1 SE.
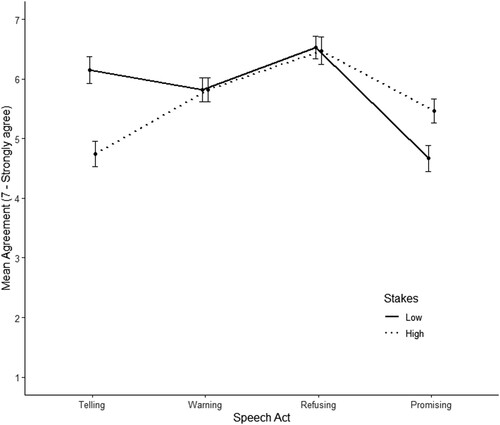
Table 3. Mean agreement scores and standard deviations (SD) across speech acts, stakes, and speaker awareness.
Figure 5. Mean agreement scores across speech acts, stakes, and group. Error bars represent +/− 1SE.
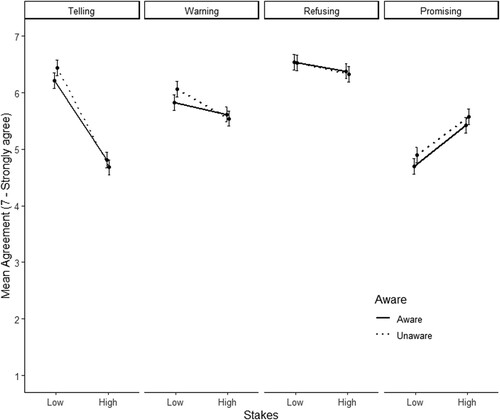
Figure 6. Line graph showing the interaction effect between stakes and speech act. There were stakes effects across all cases apart from the refusing cases. Error bars represent +/− 1 SE.