Figures & data
Table 1. Authors’ research interests.
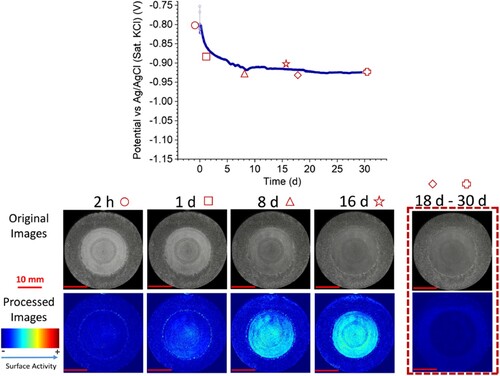
Figure 1. Secondary electron SEM images of RR1000 HIP alloy electropolished for 120 min at 10 V in 2Eg:ChCl, (a) image showing the boundary region between unpolished (top) and polished (bottom) surfaces, (b) SEM in profile showing the etch-step edge (taken with permission from ref. Citation15).
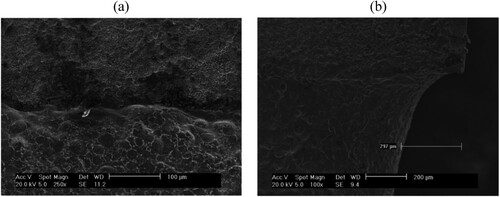
Figure 2. Rolls-Royce Trent IP turbine blade before (top) and after (bottom) electropolishing in 2Eg:ChCl for 30 min in a six-blade batch trial process (taken with permission from ref. Citation16).
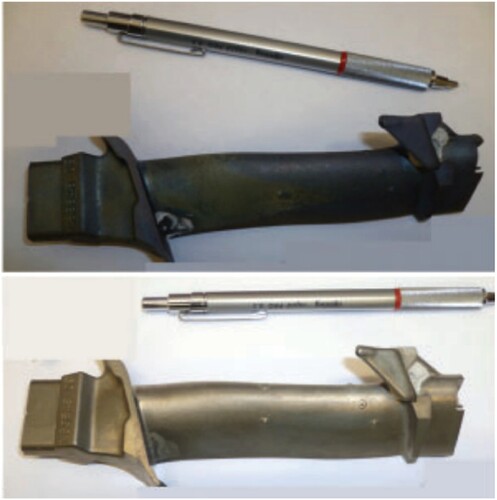
Figure 3. Back-scattered electron SEM images of cobalt-SiC nanocomposite, produced by pulse-reverse plating (PRP) technique (taken with permission from ref. Citation18).
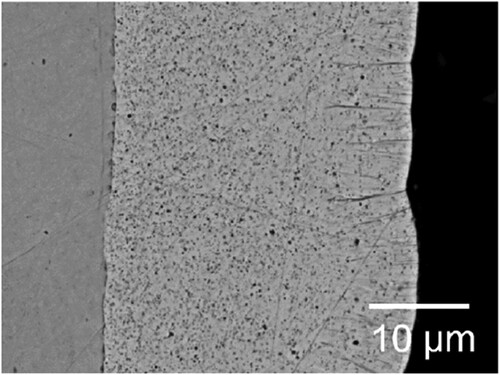
Figure 4. Toolbox of techniques to process a range of metallic and semiconductor structures in organic and inorganic phases (adapted from ref. Citation20).
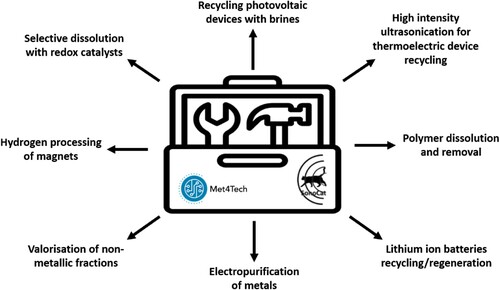
Figure 5. Images showing a battery anode before and after processing with different ultrasonication techniques. An ultrasonic bath (power intensity ∼ 0.02 W cm−2) at room temperature for 5 mins was used in images (a–d). (a) and (b) show electrode material made with gelatin binder and (c) and (d) show electrode material made with sodium alginate binder. Images (e) and (f) show the effect of a high-powered ultrasonic horn (power intensity ∼ 398 W cm−2) on the gelatin electrodes at 10% power for 5 s (taken with permission from ref. Citation23).
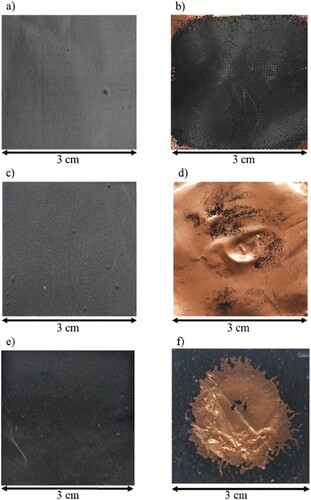
Figure 6. Optical-electrochemical monitoring of thermal sprayed aluminium coating with 30% of exposed steel after removing the calcareous deposits formed on the top of the steel (C-30R). Top: open circuit potential (OCP) measurement over 30 s. Bottom: Original and processed sequential images (taken with permission from ref. Citation28).