Figures & data
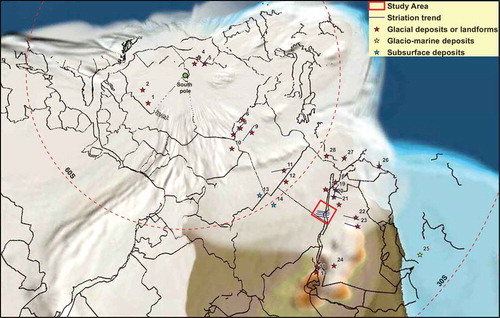
Figure 1. Location map showing the reported Early and Late Paleozoic glacial deposits and landforms (Late Ordovician: 1 to 28; Permo-Carboniferous: 29 to 38) from northern Gondwana. 1. (Ghienne and Deynoux Citation1998); 2. (Ghienne Citation2003); 3. (Le Heron Citation2007; Ravier et al. Citation2015); 4. (Le Heron and Craig Citation2008); 5. (Ghienne et al. Citation2007; Ravier et al. Citation2015); 6. (Lang et al. Citation2012); 7. (Le Heron et al. Citation2005); 8. (Le Heron et al. Citation2006); 9. ((Le Heron et al. Citation2004); 10. (Denis et al. Citation2007); 11. (Le Heron and Craig Citation2008); 12. (Klitzsch Citation1978; Issawi and Jux Citation1982; Issawi and Osman Citation1996); 13&14. (Semtner et al. Citation1994); 15 and 16. (Issawi and Jux Citation1982); 17. (Kumpulainen et al. Citation2006; Kumpulainen Citation2008); 18. (Kumpulainen Citation2008; Lewin et al. Citation2018); 19. (Abed et al. Citation1993; Turner et al. Citation2005); 20. (Tofaif et al. Citation2018); 21. (Vaslet et al. Citation1994; Michael et al. Citation2018); 22. (McClure Citation1978; Vaslet Citation1990; Aoudeh and Al-Hajri Citation1995); 23. (Vaslet Citation1990; Clark-Lowes Citation2005; Melvin Citation2018); 24. (Al-Husseini Citation2004; Al-ajmi et al. Citation2008; Keller et al. Citation2011); 25. (Ghavidel-syooki et al. Citation2011); 26, 27, and 28. (Monod et al. Citation2003; Ghienne et al. Citation2010); 29. (Lang et al. Citation1991); 30. (Le Heron Citation2018); 31. (Klitzsch Citation1983); 32. (Lewin et al. Citation2018); 33. (Bussert Citation2010, Citation2014; Lewin et al. Citation2018); 34. (Kruck and Thiele Citation1983; El-Nakhal Citation1984); 35. (Alsharhan et al. Citation1993; Al-Husseini Citation2004; Al-ajmi et al. Citation2008; Keller et al. Citation2011); 36. (Melvin and Sprague Citation2006). 37. (Martin et al. Citation2008; Heward and Penney Citation2014); 38. (Braakman et al. Citation1982; Al-Belushi et al. Citation1996).
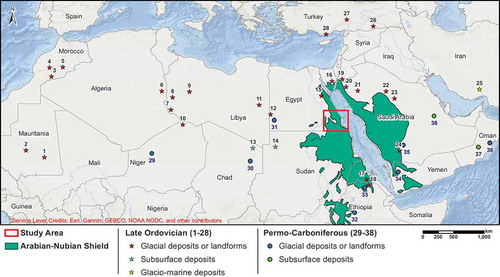
Figure 2. Simplified geological map for the study area extracted from EGPC-Conoco Coral Citation1987; EGSMA Citation1996.
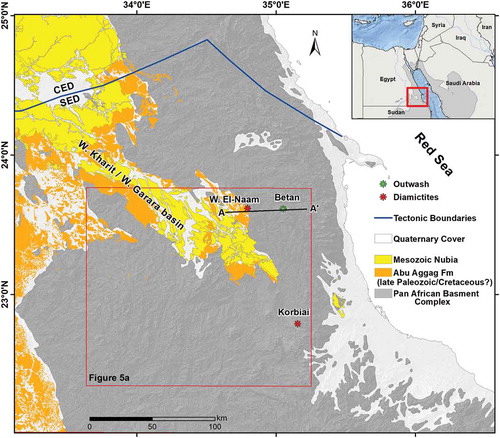
Figure 3. Field photographs for glacial diamictites in the SED from Wadi El-Naam (a, b, c, and d) and Korbiai (e, f, and g). (a) Glacial diamictites [Dmm] unconformably overlying a preglacial paleosol [S] of Cambrian-Ordovician age in Wadi El-Naam drumlin hill. (b) Thick deposits (~20 m) of massive boulder-rich diamictites. (c) Matrix supported, sub-angular to rounded clasts occasionally showing elongation along sub-horizontal axes. (d) Rotated clasts within the glaciotectonite layer at the base of glacial diamictites. (e) Unsorted boulder-rich diamictites [Dmm] overlying an uneven basement surface [B]. (f) Poorly sorted, well rounded to sub-angular, matrix supported diamictites. (g) Fining upward diamictite clasts, which could be indicative of an ice retreat depositional environment.
![Figure 3. Field photographs for glacial diamictites in the SED from Wadi El-Naam (a, b, c, and d) and Korbiai (e, f, and g). (a) Glacial diamictites [Dmm] unconformably overlying a preglacial paleosol [S] of Cambrian-Ordovician age in Wadi El-Naam drumlin hill. (b) Thick deposits (~20 m) of massive boulder-rich diamictites. (c) Matrix supported, sub-angular to rounded clasts occasionally showing elongation along sub-horizontal axes. (d) Rotated clasts within the glaciotectonite layer at the base of glacial diamictites. (e) Unsorted boulder-rich diamictites [Dmm] overlying an uneven basement surface [B]. (f) Poorly sorted, well rounded to sub-angular, matrix supported diamictites. (g) Fining upward diamictite clasts, which could be indicative of an ice retreat depositional environment.](/cms/asset/6dcdafa6-a31d-4383-a2c9-f99a137d84b0/tigr_a_1636416_f0003_c.jpg)
Figure 4. Field photographs of outwash deposits in a wide plain (area: 0.5 km2) within the basement outcrop area in the Betan area, showing many ancient gold mining pits targeting glacially hosted placer gold deposits. Inset: An ancient pit showing moderately sorted, well rounded clasts with sub-horizontal bedding planes that could indicate deposition in a proximal ice marginal meltwater environment.
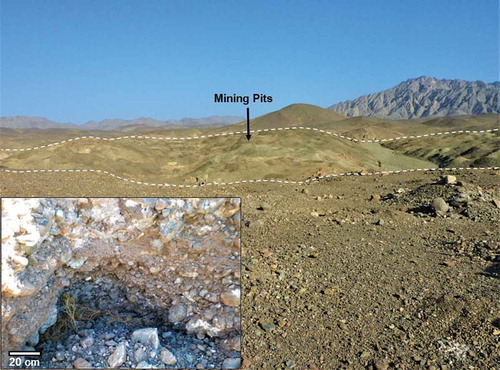
Figure 5. Mapping of the MLs in the SED using ALOS PALSAR, multispectral Landsat 8, and ALOS DEM data. (a) ALOS PALSAR backscatter mosaic for the study area (left) and interpretation map showing the distribution of MLs (right). (b) Left: enlargement of the area covered by the blue boxes in Figure 5(a) showing ENE-WSW trending linear sub-parallel megaridges (bright) and intervening megagrooves (dark). Right: interpretation map showing the distribution of MLs (red lines), which indicate paleo-ice flow directions. (c) Landsat 8 multi-spectral image (RGB, Landsat bands 753) for the area covered by blue box in Figure 5(a) showing linear megaridges (dark) and intervening megagrooves (bright) and an interpretation map showing the distribution of MLs (red lines). (d) 3D view (vertical exaggeration: 6×) for the area covered by blue box in Figure 5(a) with the ALOS PALSAR data draped over the ALOS DEM showing the distribution of megaridges and intervening ENE-WSW oriented megagrooves.
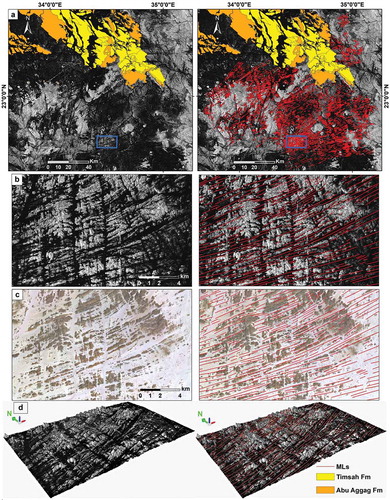
Figure 6. Wadi El-Naam drumlin hills. (a) Arc GIS base map image for the drumlin hills of Wadi El-Naam between the basement (east) and the PG-NSF (west). (b) Cross section along the AAʹ line.
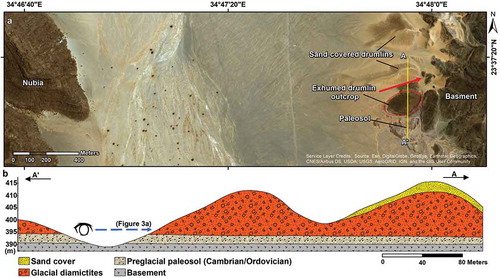
Figure 7. Schematic west-east cross section along A-Aʹ profile (see location in ) showing glacial deposits at the base of the Nubia Sandstone Formation and within topographic lows in the basement, the mapped MLs, and a facies change from subglacial diamictites (Wadi El-Naam) to meltwater outwash (Betan), and a possible location for the ice margin between both areas.
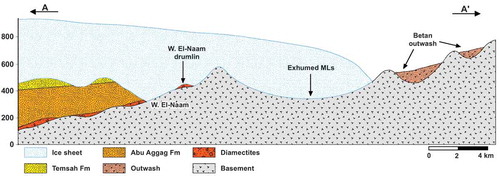
Figure 8. Paleo-reconstruction map (445 Ma) for the reported deposits and striation trends (1 to 28; refer to caption of ) from the northern Gondwana Late Ordovician ice sheet (from ) plotted over the Gondwana paleogeographic base map (Scotese Citation2016; Scotese and Wright Citation2018) using the stereographic south polar projection.