Figures & data
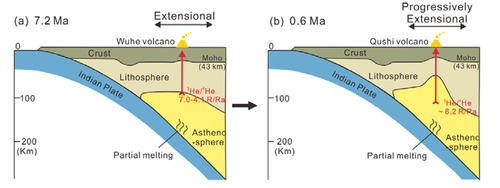
Figure 1. Major tectonic units in the collision and subduction zones between the Indian and Eurasian plates. (a) Overview map showing the main tectonic settings. The red triangles denote Quaternary volcanoes in Myanmar and Yunnan, China. The purple stars denote the great earthquakes with magnitudes larger than Mw 7.5 around Tengchong. The black lines mark the major faults in and near the Tibetan Plateau (Mo et al. Citation2006). The red rectangle indicates the study area. (b) Location of the Tengchong volcanic field in southwestern China (modified from Zhou et al. Citation2012). (c) Distribution of magmatic rocks from different periods in the Tengchong volcanic field (modified from Cheng et al. Citation2020).
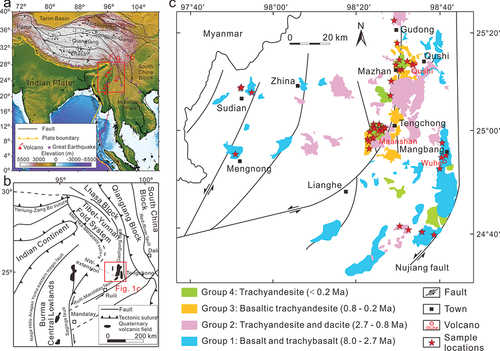
Figure 2. Photomicrographs of minerals and inclusions in the Tengchong volcanic rocks. (a) Columnar jointed basalt in Wuhe County. (b) Basalt with a vesicular structure. (c-d) Olivine, plagioclase and clinopyroxene phenocrysts in magmatic rocks. (e) Inclusions in an olivine phenocryst. (f) Magnified images outlined by the red rectangle in (e), showing fluid and melt inclusions in the olivine phenocryst.
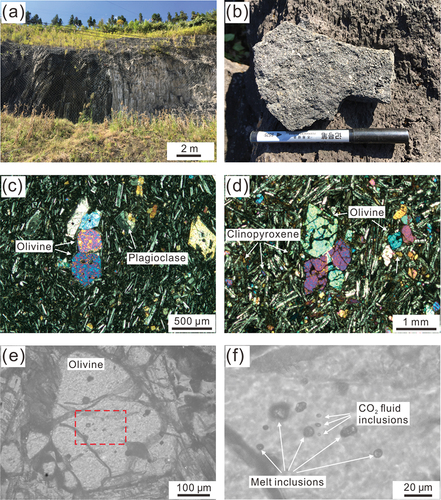
Figure 3. Whole-rock major element compositions of the Tengchong volcanic rocks. (a) Diagram of the total alkali (K2O+Na2O) versus SiO2. The classification boundaries are from Le Bas et al. (Citation1986) and Le Maitre et al. (Citation1989). TB and BTA are the abbreviations for trachybasalt and basaltic trachyandesite, respectively. (b) Diagram of K2O versus SiO2. The boundaries are from Peccerillo and Taylor (Citation1976) and Rickwood (Citation1989). The symbols used in this figure are identical to those in other figures.
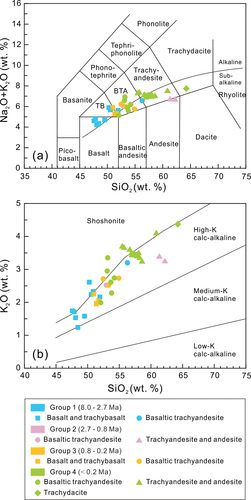
Figure 4. Diagram of primitive mantle-normalized trace elements (a-d) and chondrite-normalized rare earth elements (e-h). The normalization factors are from Sun and McDonough (Citation1989). The red curve is the database for ocean Island basalts (OIBs) (Sun and McDonough Citation1989); the black curve is the database for Indian sediments (Plank and Langmuir Citation1998); the green curve is the database for enriched mantle (EM) with type-II features (Workman et al. Citation2004); and the blue curve is the database for normal mid-ocean ridge basalts (N-MORB) (Sun and McDonough Citation1989).
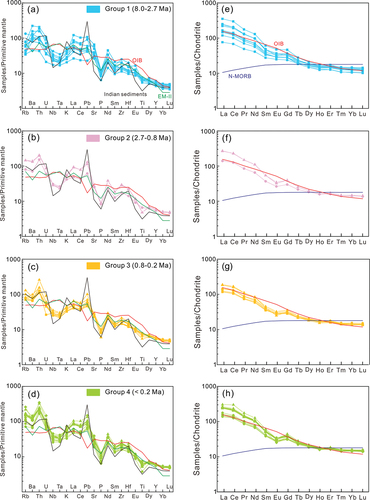
Figure 5. Sr-Nd-Pb isotopic ratios of Tengchong volcanic rocks. Plots (a-d) are diagrams of 87Sr/86Sr versus SiO2, 143Nd/144Nd versus 87Sr/86Sr, 207Pb/204Pb versus 206Pb/204Pb, and 208Pb/204Pb versus 206Pb/204Pb, respectively. The compositions of depleted MORB mantle (DMM) are from Workman and Hart (Citation2005); those of EM-I and EM-II are from Hofmann (Citation1997); and the Northern Hemisphere Reference Line (NHRL) is from Hart (Citation1984). Gray dots in (a) are the samples in the literature (Chen et al., Citation2002; Zhou et al. Citation2012; Guo et al. Citation2015; Zou et al. Citation2017; Cheng et al. Citation2018, Citation2020; Tian et al. Citation2018). The isotopic compositions of two geochemical end-members in plot (b) are based on Miller et al. (Citation1999) and Cheng et al. (Citation2020). In plot (b), the dotted curve denotes two-component mixing.
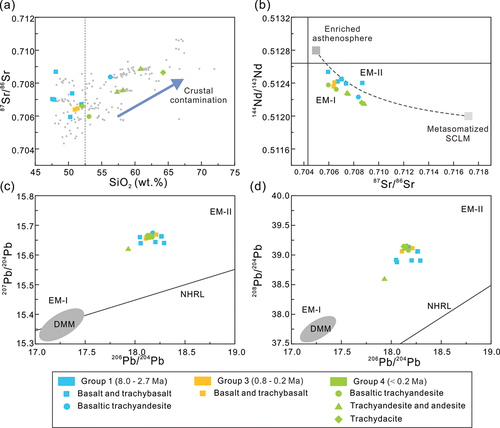
Figure 6. He-Ar isotope diagram for Tengchong volcanic rocks. (a) 3He/4He versus 4He/40Ar*. The ranges of MORB and SCLM are from Graham (Citation2002) and Gautheron and Moreira (Citation2002), respectively. Green diamond denotes the pyroxene phenocryst and the other samples are all olivine phenocrysts. (b) 3He/4He versus 4He concentrations. (c) 3He/4He versus Zr/Y. The sample in the red dashed circle represents magmas that underwent crustal assimilation.
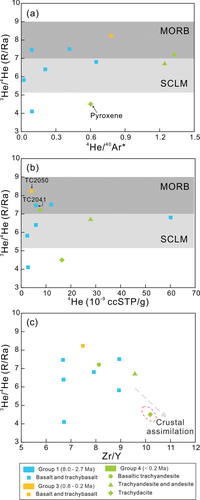
Figure 7. 87Sr/86Sr versus Nb/La and La/Yb in the Tengchong basalts. Filled squares denote data from this study, and empty squares are from the literature (Zhang et al. Citation2012; Zou et al. Citation2017; Cheng et al. Citation2018, Citation2020; Tian et al. Citation2018).
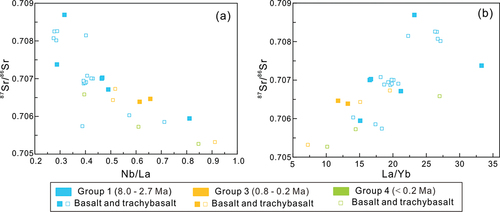
Figure 8. Diagrams of a two-component mixing model between metasomatized SCLM and enriched asthenosphere using He-Sr isotopes and trace elements. (a) Plot of La/Yb versus Nb/La in the Tengchong basalts (modified from Watson, Citation1993; Zhou et al. Citation2012), and filled squares denote data from this study, and open squares are from the literature (Zhang et al. Citation2012; Zou et al. Citation2017; Cheng et al. Citation2018, Citation2020; Tian et al. Citation2018). (b) Plot of 3He/4He versus 87Sr/86Sr. (c) Plot of 3He/4He versus Nb/La. (d) Plot of 3He/4He versus La/Yb. For metasomatized SCLM, the value of 87Sr/86Sr is approximately 0.717 (Miller et al. Citation1999); the values of 3He/4He are approximately 4.1–7.0 Ra (this study; Gautheron and Moreira Citation2002; Lee et al. Citation2021); the ratio of Nb/La can be 0.3 (the lowest value in Tengchong); and the La/Yb ratio can be 35 (the highest value in Tengchong). For enriched asthenosphere, the value of 87Sr/86Sr can be 0.705 (Cheng et al. Citation2020), the 3He/4He ratio is approximately 8.0 Ra (Poreda and Craig Citation1989; Graham Citation2002), the Nb/La ratio is approximately 0.9 (the highest value in Tengchong), and the La/Yb ratio is approximately 5.0 (the lowest value in Tengchong). The solid lines represent the two-component mixing relationships.
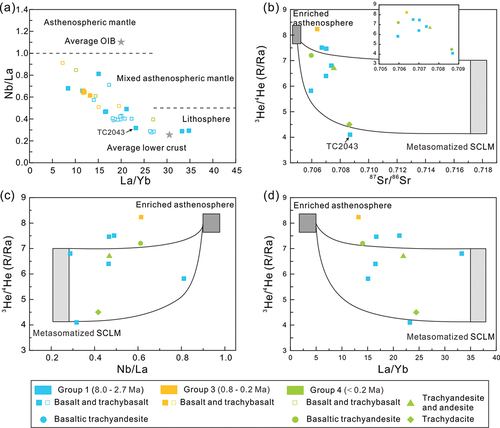
Figure 9. Variations in 3He/4He (Ra) and 87Sr/86Sr ratios in the Tengchong basalts as a function of time (Ma). In plot (a), filled squares denote data from this study, and the open green squares are from Zhang et al. (Citation2021b). In plot (b), the open squares are from the literature (Zhang et al. Citation2012; Zou et al. Citation2017; Cheng et al. Citation2018, Citation2020; Tian et al. Citation2018). The ages of samples are based on previous studies (Mu et al. Citation1987; Li et al. Citation2019; Guo et al. Citation2015; Zou et al. Citation2017; Cheng et al. Citation2020).
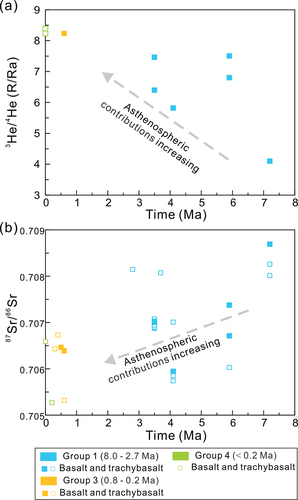
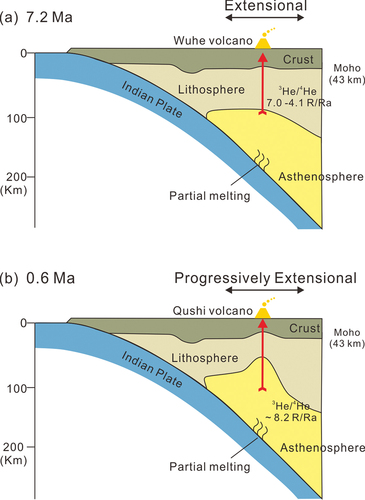
Figure 10. Schematics illustrating the magma origin beneath Tengchong volcano. The magma of Tengchong volcano is from two end-member mixing of metasomatized SCLM and enriched asthenospheric mantle. At 7.2 Ma, the extension of the lithosphere resulted in lithospheric thinning. At 0.8 Ma, the thin lithosphere allowed the easy upwelling of deep asthenospheric mantle and resulted in a significant contribution from the enriched asthenosphere.