Figures & data
Figure 1. (A) Simplified tectonic map showing the Central Asian Orogenic Belt (modified from Jahn et al. Citation2000); (B) Topographic map and terminology of the of North Xinjiang and adjacent area of the SW Central Asian Orogenic Belt (basemap from website http://www.ngdc.noaa.gov/mgg/global) showing the North Tianshan, Central Tianshan, South Tianshan and Southern Beishan from north to south; (C) Geological map showing the location of study area in Eastern Tianshan (Zhou et al. Citation2010; Zhang et al. Citation2011; Kröner et al. Citation2013; Breiter et al. Citation2014; Wang et al. Citation2017). Data sources for ages, εNd(t) and εHf(t) values of felsic intrusive rocks are presented in Table A6. Abbreviation: (Ad)- adakitic granite; (H)- highly fractionated granite; (I)- I-type granite; (Alk)- alkalic granite; (A)- A-type granite.
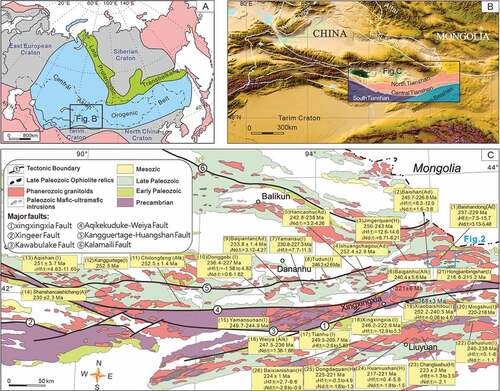
Figure 2. (A) ETM image and (B) Geological map of the Baishandong pluton, after XBGMR (1993) .
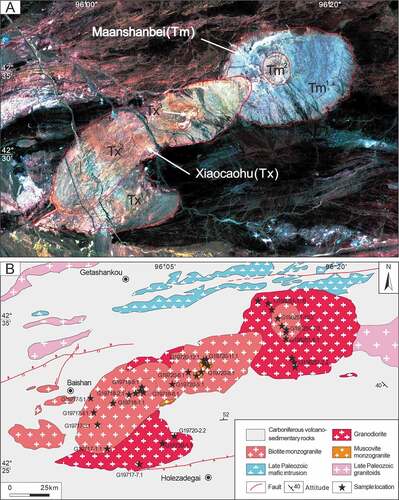
Figure 3. (A) Mineral maps of the Baishandong granitoids by TIMA; (B) A ternary QAP plot showing the relative modal proportions of quartz (Q), alkali feldspar (A), and plagioclase (P) to define the IUGS fields for the rocks (after Le Maitre, Defant et al. Citation2002; Chen et al. Citation2005) .

Figure 4. Representative photographs of the rocks of Baishandong pluton. (A)-(B) granodiorite; (C)-(D) biotite monzogranite; (E) muscovite monzogranite. (F)-(G) dioritic enclaves. (H) Porphyritic-like texture of granodiorite from Maanshanbei suit (Tm1); (I) Granitic texture of medium-fine-grained granodiorite from Xiaocaohu suit (Tx1); (J) Granitic texture of fine-grained monzonitic granite from Maanshanbei stock (Tm2); (K) Porphyritic-like texture of medium-fine-grained monzonitic granite from Xiaocaohu stock (Tx2); (L), (M) Granitic texture of medium-fine-grained monzonitic granite from Xiaocaohu stock (Tx3). Abbreviation: Qz = quartz; Pl = plagioclase; Kf = feldspar; Bt = biotite; Mu = muscovite; Hb = hornblende; Or = orthoclase; Ab = albite; Chl = Chlorite.
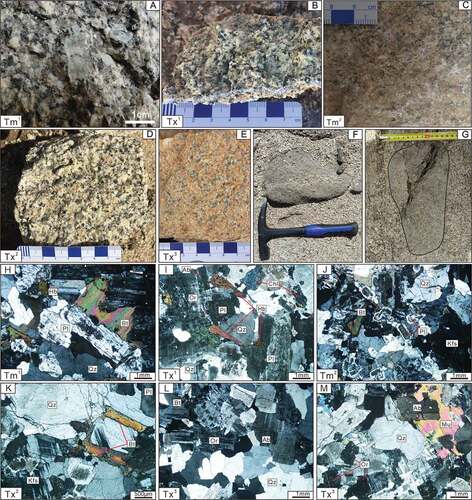
Figure 5. (A)-(E) Representative zircon cathodoluminescence images of various granitoids from the Baishandong pluton. The yellow, blue and red circles and numbers on zircons show the positions and results for U-Pb, O and Lu-Hf isotope analysis, respectively. (F) The Chondrite-normalized REE patterns of zircons from the Baishandong pluton.
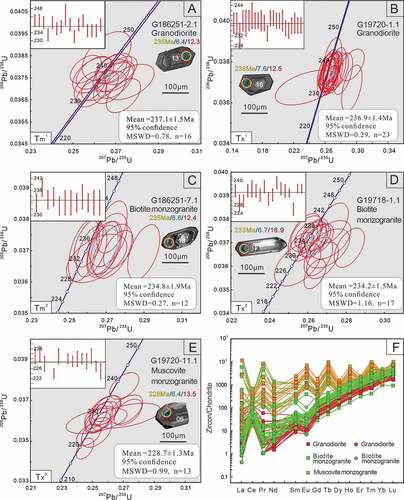
Figure 6. Discrimination diagrams for the granites from Baishandong pluton. (A) TAS classification diagram of the granitoids from Baishandong pluton, after Middlemost (Brown Citation1994); (B) K2O-SiO2 diagram after (Zhou et al. Citation2010; Zhang et al. Citation2011; Kröner et al. Citation2013; Breiter et al. Citation2014; Wang et al. Citation2017). The shadow area represents pre-Mesozoic slab melting adakites in Eastern Tianshan (Mao et al. Citation2021); (C) A/NK-A/CNK diagram after (Masuda and Akagi Citation1989). Hark variation diagrams showing the major and trace element variations of the Triassic Baishandong pluton in the Eastern Tianshan; (D) TiO2, (E) Al2O3, (F) FeOT, (G) MgO (Martin et al. Citation2005), (H) Mg#, Reference fields are from (Gu et al. Citation2006; Kröner et al. Citation2011), (I) P2O5, respectively.
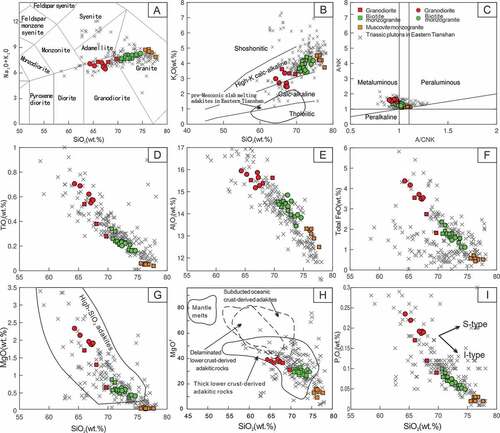
Figure 7. The Chondrite normalized REE patterns and N-MORB normalized trace element diagrams for Triassic Baishandong pluton in the Eastern Tianshan. The chondrite values and N-MORB values are from (allen et al. Citation1995) and Sun et al., Citation1989.
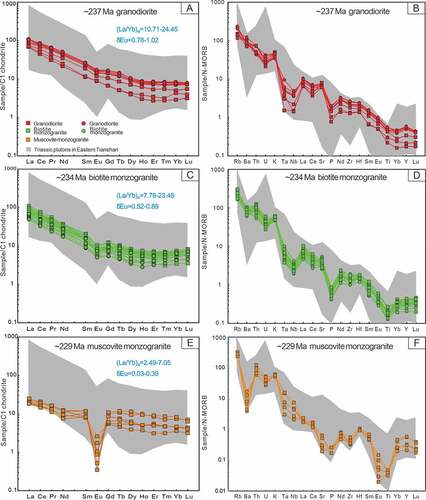
Figure 8. The whole-rock geochemical discriminative diagrams of the Baishandong Pluton. (A) FeOT/MgO, and (B) (K2O+Na2O)/CaO vs. (Zr+Nb+Ce+Y) classification diagrams (Barnes et al. Citation1996), FG: Fractionated felsic granites; OGT: unfractionated. (C) Sr/Y vs. Y diagram from (Defant and Drummond Citation1990; Barbarin Citation1999); (D) (La/Yb)N vs. YbN; (E) K/Rb vs. K/Ba; (F) Zr/Hf vs. ?Eu in which the common range of granites is reported by (Bau Citation1996; Jahn et al. Citation2001); (G)-(J) SiO2 vs. Dy/Yb, Sm/Nd, Sr/Y, and Zr/Hf diagrams; (K) La vs. La/Sm diagram; (L) Nb/U vs. Ce/Pb diagram. Trace elements are plotted in ppm, Chondrite values are from (Masuda and Akagi Citation1989) .
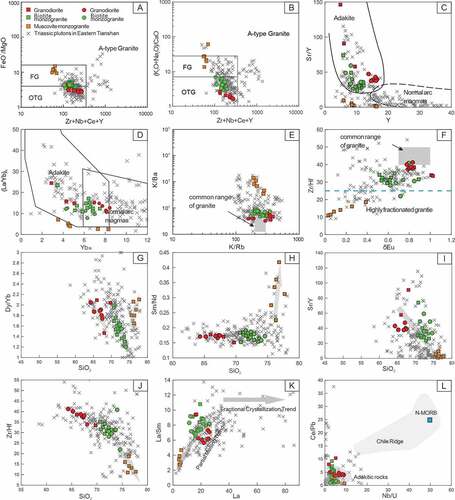
Figure 9. Correlations between Hf isotopic compositions and U-Pb zircon ages of from the Baishandong pluton in the Eastern Tianshan. CHUR = chondritic uniform reservoir; DM = depleted mantle, Data of the Neoproterozoic granites from Chang et al. (Citation2018) .
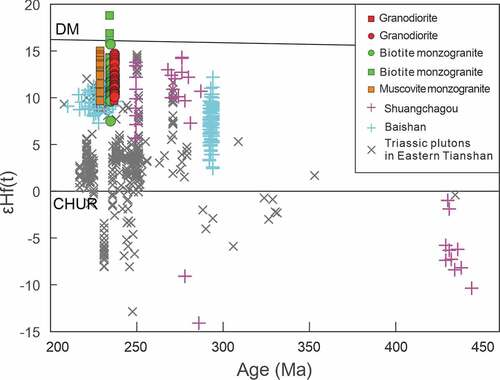
Figure 10. (A) εNd(t) vs. SiO2 diagram for the granitoids of the Baishandong pluton; (B) Whole-rock δ18O and initial 87Sr/86Sr correlation diagram (after James, Citation1981), Whole-rock δ18O ratios were calculated based on the formula proposed by Valley et al. (Citation1998); (C) Whole-rock εNd(t) vs. (87Sr/86Sr)i after (Zindler et al. Citation19862007b) for the Baishandong pluton; (D) Zircon δ18O vs. εHf(t). The εHf(t) values of depleted mantle, the SCLM beneath the NCC, mixed mantle, and ancient crust are +16.2, ﹣8 (Guan et al. Citation2012),+6, and﹣16, respectively. The ?18O of ancient crust and mantle are +9.5 ± 0.5‰ (average of 2.5 Ga and 1.8 Ga crust) and + 5.3 ± 0.3‰ (Brown Citation1994) .
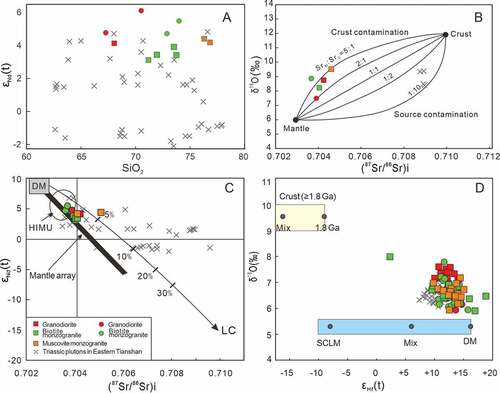
Figure 11. (A) Histograms of ages of granitoids in the Eastern Tiansha. Locations of the five areas are shown in ; (B)-(C) Plot of Sm/Yb and Dy/Yb ratios versus rock ages from the North Tianshan and Central Tianshan. Arrows in diagram B highlight the different episodes of crustal thickening. The dashed horizontal line in the Dy/Yb diagram marks the boundary between garnet-dominated (>2) and amphibole-dominated (<2) compositions. Low values of the Dy/Yb ratio indicative of amphibole involvement, show a significant increase at ca. 240 Ma and afterwards, whereas higher values of the Sm/Yb ratio, which is indicative of garnet involvement, have notably increased during the Later Permian and Early Triassic.
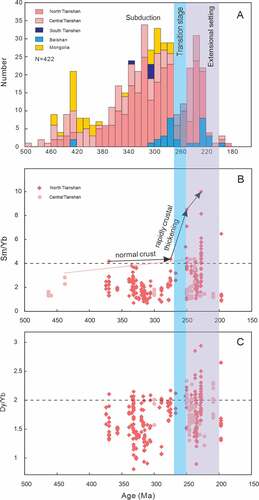
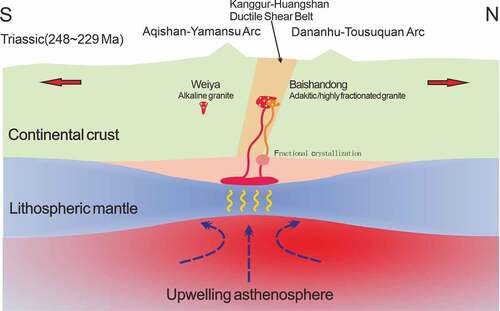
Figure 12. Schematic diagram showing the generation of the Baishandong pluton in the Eastern Tianshan. Thickness of continental crust and lithospheric mantle are not to scale.