Figures & data
Figure 1. Geological map of the Rustenburg Layered Suite of the Bushveld Igneous Complex (after Maier et al. Citation2021b) showing sample locations of the UG-2 reference and UG-2E samples used in this study (black squares).
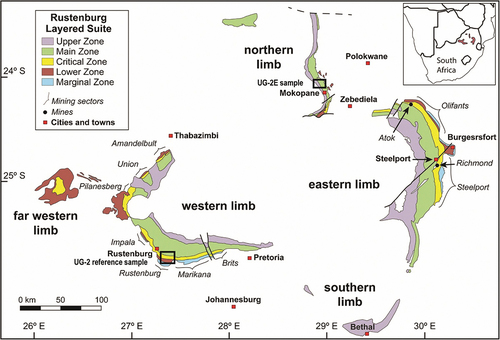
Figure 2. Simplified stratigraphic profiles of the studied drill core sections. (a) UG-2 reference. (b) UG-2E. The UG-2E is not as massive as the UG-2 reference.
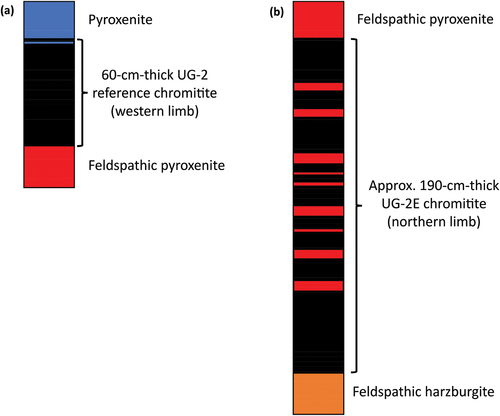
Figure 3. Representative samples of the UG-2 reference chromitite and representative samples of the UG-2E chromitite showing its textural variability. (a) Sample of the massive UG-2 reference mounted in epoxy puck (middle of chromitite). (b) Sample of the massive UG-2E (towards bottom of chromitite). (c) Sample of the patchy UG-2E (middle of chromitite). (d) Sample of the disseminated UG-2E (middle of chromitite). UG-2E samples made into 100-micron-thick thin sections.
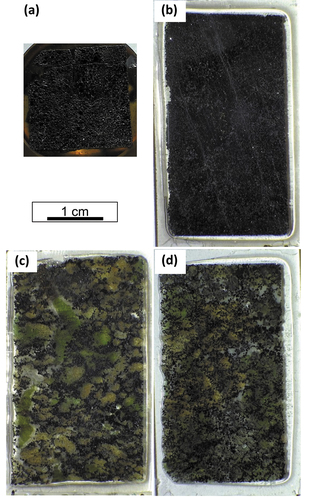
Figure 4. Reflected light photomicrographs (reflected light) of representative chromitite samples from the massive section of the UG-2E and the UG-2 reference suite (modified after Langa et al. Citation2021a). (a) Example of the massive UG-2 reference chromitite, in which chromite grains are mostly subhedral (light grey), and range in size from 0.01 to 0.25 mm. Chromite grains occupy approximately 64% of the section, interstitial silicate minerals 36% (dark grey matrix minerals), and tiny speckles of sulphide (bright anhedral minerals in matrix) only ~ 0.5%. (b) Massive portion of UG-2E chromitite in thin section showing clustering of euhedral to subhedral chromite grains, ranging in size from 0.04 to 0.7 mm wide. Chromite (light grey areas) occupies approximately 60% of the section, whereas silicate minerals occupy approximately 39% of the section and sulphides occupy ~ 1% of the section. Black areas are mostly holes outlining chromite gains plucked out during polishing (accounted for as part of the chromite mode).
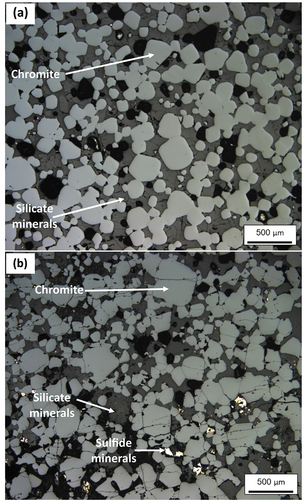
Figure 5. Stratigraphic variations in chromite composition through the UG-2 reference chromitite seam. (a) Variations in Mg#. (b) Variations in Cr#. (c) Variations in V content (LA-ICP-MS data). For reference, the base of the chromitite seam is set at 0 cm and black arrows indicate some of the most relevant shifts in chemistry. Mg# [Mg/(Mg +Fe2+)]; Cr# [Cr# = Cr/(Cr +Al)]. Error bars are 1σ uncertainty.
![Figure 5. Stratigraphic variations in chromite composition through the UG-2 reference chromitite seam. (a) Variations in Mg#. (b) Variations in Cr#. (c) Variations in V content (LA-ICP-MS data). For reference, the base of the chromitite seam is set at 0 cm and black arrows indicate some of the most relevant shifts in chemistry. Mg# [Mg/(Mg +Fe2+)]; Cr# [Cr# = Cr/(Cr +Al)]. Error bars are 1σ uncertainty.](/cms/asset/91ab878a-036d-4614-b554-5687d0fccacf/tigr_a_2169961_f0005_c.jpg)
Figure 6. Stratigraphic variations in chromite composition through the UG-2E chromitite seam. (a) Variations in Mg#. (b) Variations in Cr#. (c) Variations in V content (LA-ICP-MS data). For reference, the base of the chromitite seam is set at 0 cm. Error bars are 1σ uncertainty.
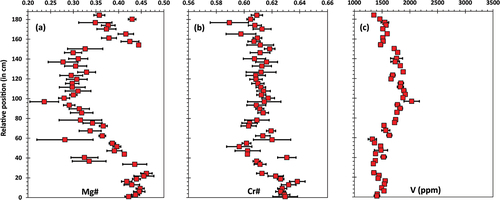
Figure 7. Stratigraphic variations in chromite modal proportions. (a) Variations within the UG-2E chromitite. (b) Variations within the UG-2 reference chromitite.
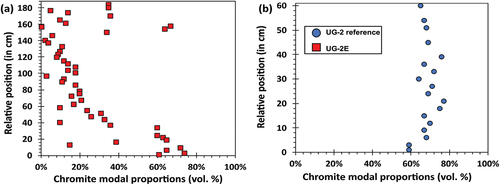
Figure 8. Comparison of the stratigraphic variations in some trace element contents in chromite chemistry between the UG-2 reference (top row, blue circles) and the UG-2E (bottom row, red squares). Trace elements shown, from left to right: Mn, Zn, Co, Ni, Ti, Ga, Ge. Error bars are 1σ uncertainty.
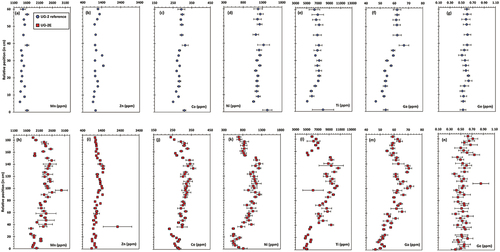
Figure 9. Variations in minor and trace elements content in chromite in the UG-2E as a function of modal chromite abundance (red squares), compared to the UG-2 reference (blue circles). (a) Mn. (b) Zn. (c) Co. (d) Ni. (e) V. (f) Ti. (g) Ga. (h) Ge. Error bars are 1σ uncertainty.
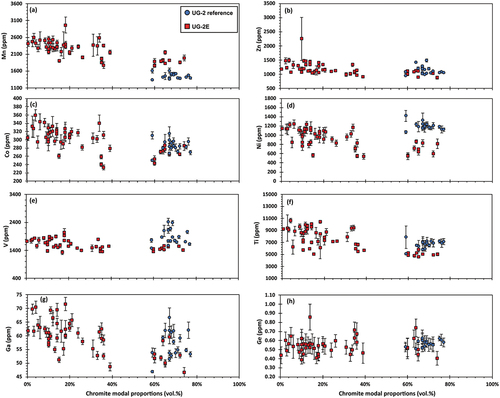
Figure 10. Stratigraphic variations in Fe3+/∑Fe [Fe3+/(Fe2++Fe3+)] of chromite. (a) Within the UG-2E chromitite. (b) Within the UG-2 reference chromitite.
![Figure 10. Stratigraphic variations in Fe3+/∑Fe [Fe3+/(Fe2++Fe3+)] of chromite. (a) Within the UG-2E chromitite. (b) Within the UG-2 reference chromitite.](/cms/asset/37fcc000-a153-405e-9239-91b7534be532/tigr_a_2169961_f0010_c.jpg)
Figure 11. Mg# vs. Cr# for chromites in massive chromitites from the UG-2 and UG-2E of the Bushveld Complex (modified after Langa et al. Citation2021a). Note the direct overlap of UG-2E chromite samples with Mg# ≥ 0.4 and Cr# ≥ 0.62 with UG-2 samples.
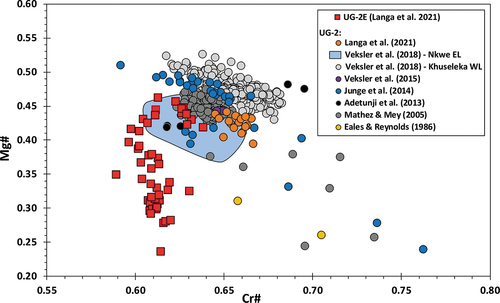
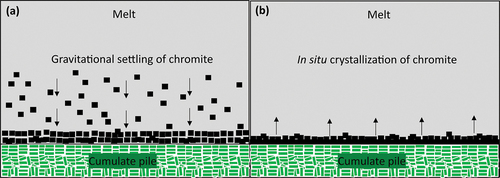
Figure 12. UG-2 reference and UG-2E chromitite petrogenetic models. (a) Gravitational settling of chromite to form chromitite. (b) In situ crystallization of chromite to form chromitite.