Figures & data
Table 1. Participant Demographics
Figure 1. PRISMA Participant Flowchart
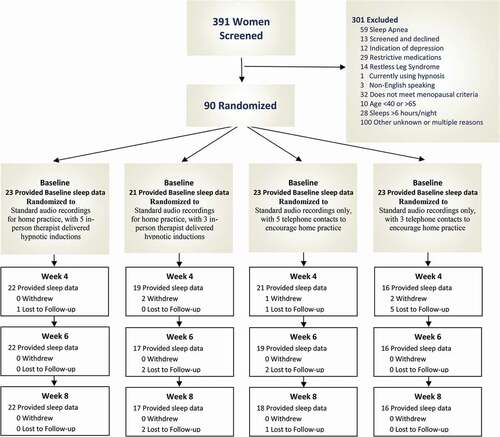
Figure 2. Program Evaluation and Treatment Satisfaction Ratings
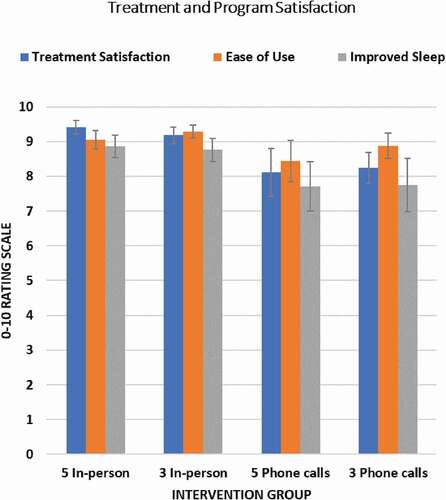
Figure 3. Percent of Participants in Each Group Achieving a Clinically Meaningful (≥ 0.5 SD) Improvement in Sleep Quality (PSQI) at Week 6 Endpoint and Week 8 Follow-Up
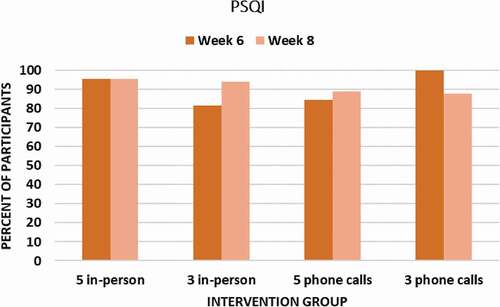
Figure 4. Percent of Participants in Each Group Achieving a Clinically Meaningful (≥ 0.5 SD) Improvement in Objective Sleep Duration (Wrist Actigraphy) at Week 6 Endpoint and Week 8 Follow-Up
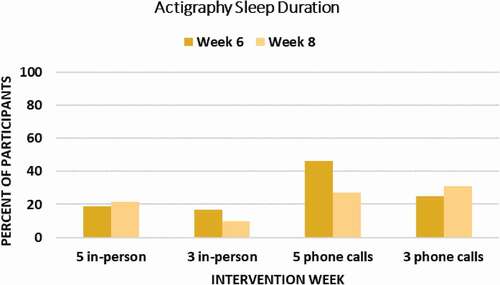
Figure 5. Percent of Participants in Each Group Achieving a Clinically Meaningful (≥ 0.5 SD) Improvement in Subjective Sleep Duration (Sleep Diary) at Week 6 Endpoint and Week 8 Follow-Up
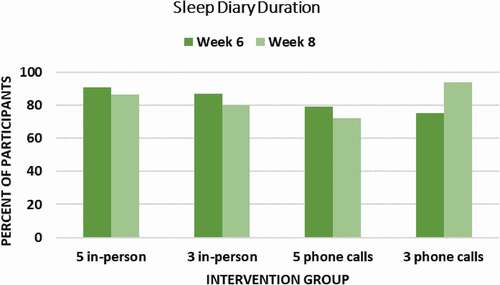
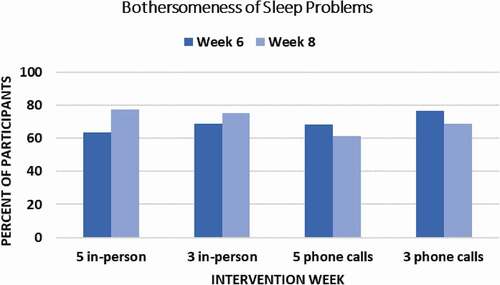
Figure 6. Percentage of Participants Achieving a Clinically Meaningful Reduction (≥ 0.5 SD) in Sleep-related Bothersomeness at Week 6 Endpoint and Week 8 Follow-Up