Figures & data
Figure 1. Setup for computer simulation of the femtosecond pulse interaction with a semiconductor. ,
– external electric field strength (x, y are dimensionless spatial coordinates).
Figure 2. Square root from the intensity distribution of incident pulse (a) and a distribution of square root from the intensity along y-coordinate at beam centre on x-coordinate (b).
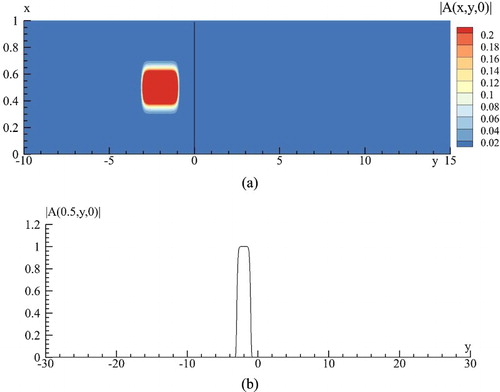
Figure 3. Qualitative dependence of the absorption coefficient from the free-electron concentration at various values of the parameters multiplication .
Figure 4. Template of the mesh function definition.
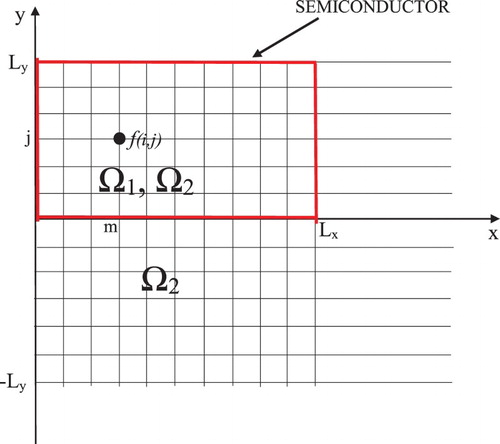
Figure 5. Distribution of square root from laser pulse intensity at time moment t = 0 (a),1.4 (b), 3.6(c), 5(d), 10(e), 20(f).
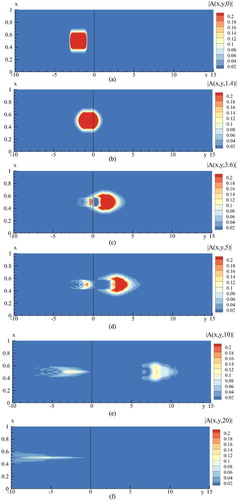
Figure 6. Square root from beam profile along y-coordinate at the beam axis on x-coordinate (x = 0.5) at time moment t = 0 (a), 1.4 (b), 3.6(c), 5(d), 10(e), 20(f).
Figure 7. Distribution of free-electron concentration n at time moment t = 3.2 (a), 3.4 (b), 3.6 (c), 4 (d), 5 (e), 10 (f).
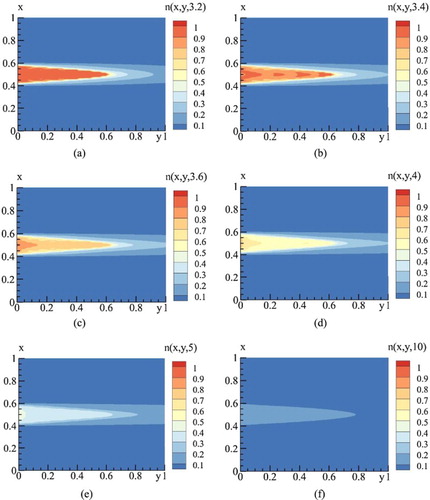
Figure 8. Square root from beam profile along y-coordinate at the beam axis on x-coordinate (x = 0.5) at time moment t = 1.4 (a), 3 (b), 3.6(c), 5(d), 10(e), 20(f).