
Figures & data
Table 1. Examples of items capturing the dimensions, including answer format (L for Likert-scale and us-u for scale of differences between upper secondary and university).
Table 2. Cronbach’s alpha with respect to the different dimensions.
Figure 1. Mean value for the level of a perceived culture clash in the group of all students (N = 154) for each dimension of a culture clash (95% confidence intervals marked).
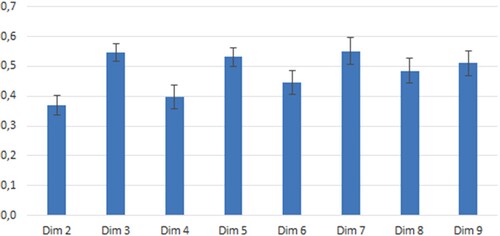
Table 3. Difference in the level of a perceived culture clash between students who had not studied at the university before (New Year 1) and students who had studied at university before but not mathematics (Experienced students), for different dimensions of a culture clash.
Table 4. Difference in the level of a perceived culture clash between students who were studying university mathematics for the first time (New Year 1) and students who were studying upper secondary mathematics within the foundation year (Foundation Year).
Table 5. Difference in the level of a perceived culture clash between students who were enrolled in a campus programme or a distance programme.
Table 6. Partial correlation between the level of a perceived culture clash and the grade from the first university mathematics course, when controlling for the mathematics grade from upper secondary school. (Information about grades was not available for all respondents.)
Table 7. Summary of all statistically significant results concerning the degree of a perceived culture clash. Empty cells correspond to no statistically significant result.