
Figures & data
Table 1. Differences between formal, informal and non-formal learning (adapted from Eshach, Citation2007).
Table 2. Basic structure for study visits, according to Orion and Hofstein (Citation1994).
Table 3. Questionnaires for companies and teachers; all items translated from Finnish into English.
Table 4. Summary of all data in the present study.
Figure 1. The upper graph shows the number of the student groups that had visited companies that answered the questionnaire in the previous two years. The lower graph describes how many companies had received students from upper secondary, lower secondary and primary schools.
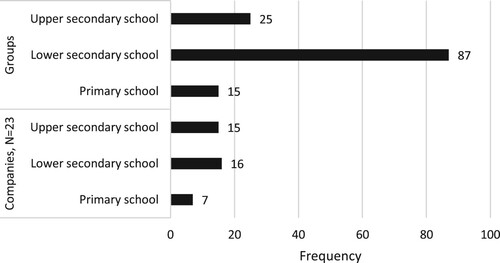
Figure 2. The structure of study visit planning at the companies.

Table 5. The students’ work before, during and after a study visit, from the viewpoint of the companies (N = 23).
Table 6. The significance of study visits from companies’ (N = 26) and teachers’ (N = 8) perspectives.
Table 7. Study visit challenges from companies’ (N = 29) and teachers’ (N = 8) perspectives.
Table 8. The development targets in study visits from the perspectives of companies (N = 29) and teachers (N = 8).
Table 9. Companies’ views of types of mathematics needed by their workers; the percentages refer to how many companies indicated that their workers needed the content area (N = 29).
Figure 3. The structures of the visits to the university and the company.
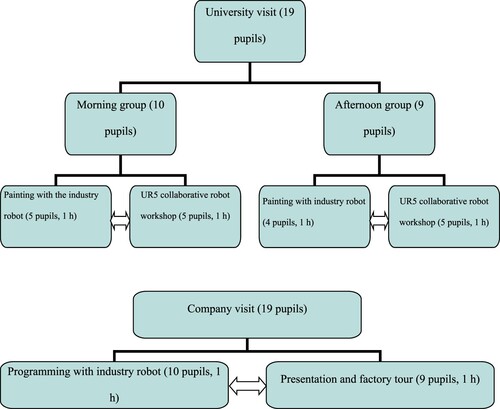
Figure 4. Students’ views on parts of the project work (N = 19).
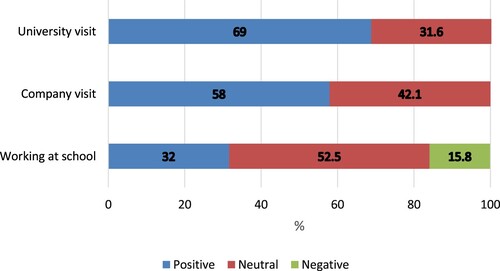
Table 10. Achievement of mathematical learning goals. The column ‘students’ opinion’ reports the number of students who reported learning that item during the project. The last two columns describe the number of students who earned at least half points or full marks, respectively, on the test that measured learning goal achievement (N = 19).