
Figures & data
Table 1. Student demographics.
Table 2. The fourteen mathematics education values and their corresponding value statements.
Figure 1. Mean value ratings from highest to lowest across all students.
Note: Value means are represented by the circle symbol and summarized on the far right. Values are ordered from the highest means at the top to the lowest means at the bottom.
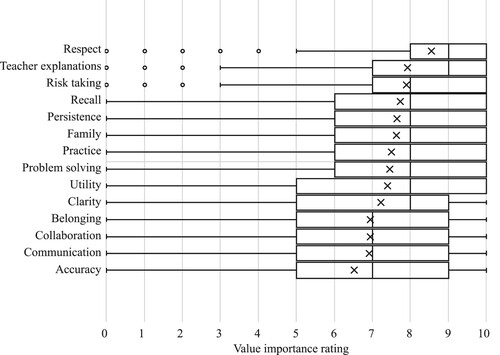
Table 3. Value means and standard deviations across all demographic groups.
Table 4. Statistically significant group differences across the values.
Data availability statement
The data that support the findings of this study are available on reasonable request from the corresponding author (Julia Hill). The data are not publicly available due to them containing information that could compromise research participant privacy.