
Figures & data
Table 1. Percentage of lessons in which participants reported playing games by setting by game mode.
Table 2. Spearman correlation coefficients by setting by game mode: teaching experience and year level taught.
Figure 1. Participant preferences for non-digital versus digital games by setting.
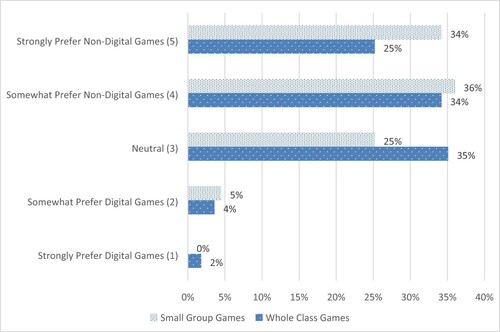
Table 3. Mean game mode preference scores by setting by experience level.
Table 4. Mean game mode preference scores by setting by year level taught.
Table 5. Participant preferences for each game mode by setting and the number of participants who provided an explanation for their preferences.
Table 6. Reasons for preferring non-digital games by game setting.
Table 7. Reasons for preferring digital games by game setting.