Figures & data
Table 1. Demographic and clinical characteristics of the study subjects.
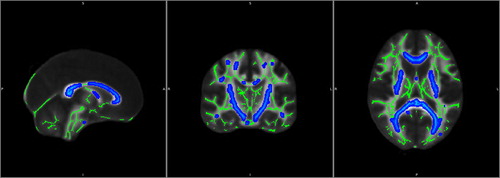
Figure 1. WM changes from baseline to the 6-month AaP treatment time point. Green pseudocolor represents normal WM and blue pseudocolor represents sites of WM impairment.
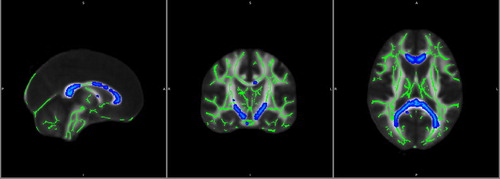
Figure 2. WM changes from baseline to the 8-month AaP treatment time point. Green pseudocolor represents normal WM and blue pseudocolor represents sites of WM impairment.
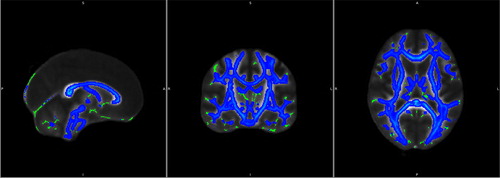
Figure 3. WM structural differences from the 6- to the 8-month AaP treatment time point. Green pseudocolor represents normal WM and blue pseudocolor represents sites of WM impairment.