
Figures & data
Table 1. Primer sequences for transfection.
Table 2. The sequences for qRT-PCR.
Figure 1. Immunofluorescence staining of hippocampal neurons. A: Green staining indicated NSE positive cells. B: Photomicrographs of DAPI staining of hippocampal neuron nucleus (Blue). C: Green staining indicated NSE positive cells and blue staining indicated nuclei. The hippocampal neuronal cells was obtained from the Wistar rats (SPF, 18-day-old, weighing 40 to 50 g, half male and half female, n = 20), all rats were sacrificed by cervical dislocation after anesthesia.
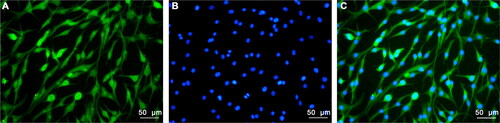
Figure 2. The effects of sevoflurane on cell viability and apoptosis. A: The miR-221-3p level in different groups was detected by quantitative real-time polymerase chain reaction (qRT-PCR). B: Cell viability in different groups was detected by Cell Counting Kit-8 (CCK-8). C: The apoptosis was promoted by sevoflurane. D: The apoptosis rate in different groups was detected by flow cytometer. Four groups were designed in this study: control group (cell cultured in 5% O2 and 95% CO2); Sev1 group (cell cultured in 5% O2, 94% CO2 and 1% sevoflurane); Sev2 group (cell cultured in 5% O2, 93% CO2 and 2% sevoflurane); Sev3 group (cell cultured in 5% O2, 92% CO2 and 3% sevoflurane). *p < 0.05 vs. control, **p < 0.01 vs. control.
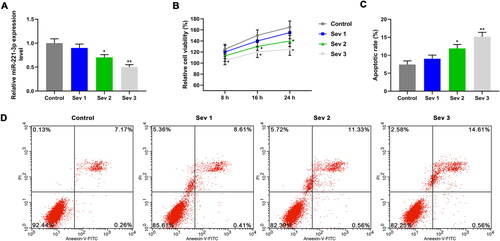
Figure 3. The effects of mimic, inhibitor alone and combined with 3% sevoflurane on cell viability and apoptosis. A: MiR-221-3p level was detected by qRT-PCR, after exposure to sevoflurane or transfection with mimic. B: MiR-221-3p level was detected by qRT-PCR, after exposure to sevoflurane or transfection with inhibitor. C: Cell viability was detected by CCK-8, after exposure to sevoflurane or transfection with mimic. D: Cell viability was detected by CCK-8, after exposure to sevoflurane or transfection with inhibitor. E: The apoptosis rate in different groups was detected by flow cytometer. F: Mimic inhibited apoptosis, and reversed the effect of 3% sevoflurane on apoptosis. G: Inhibitor promoted apoptosis, and enhanced the effect of 3% sevoflurane on apoptosis. The cells were pretreated with 3% sevoflurane or not, and miR-221-3p mimic control, miR-221-3p mimic, miR-221-3p inhibitor control, miR-221-3p inhibitor were used for cell transfection. *p < 0.05 vs. control, **p < 0.01 vs. control; #p < 0.05 vs. mimic control or inhibitor control, ##p < 0.01 vs. minmic control or inhibitor control; ^p < 0.05 vs. mimic or inhibitor, ^^p < 0.01 vs. mimic or inhibitor; △p < 0.05 vs. Mimic control + Sev3 or Inhibitor control + Sev3, △△p < 0.01 vs. Mimic control + Sev3 or Inhibitor control + Sev3.
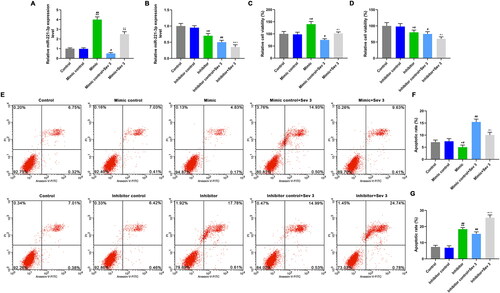
Figure 4. The effects of mimic, inhibitor alone and combined with 3% sevoflurane on CDKN1B expression. A: TargetScan was used to verify the binding sites of miR-221-3p to target genes. B: The cells were transfected with a mixture of mimic and plasmids of CDKN1B-wt or CDKN1B-mut, and luciferase activities were measured by luciferase reporter assay. C: CDKN1B protein expression was detected by western blotting (WB), after exposure to sevoflurane or transfection with mimic. D: Mimic decreased CDKN1B protein level, reversed the promotion effect of 3% sevoflurane on CDKN1B protein expression. E: Mimic decreased CDKN1B mRNA level, reversed the promotion effect of 3% sevoflurane on CDKN1B mRNA expression. F: CDKN1B protein expression was detected by WB, after exposure to sevoflurane or transfection with inhibitor. G: Inhibitor increased CDKN1B protein expression, enhanced the promotion effect of 3% sevoflurane on CDKN1B protein expression. H: Inhibitor increased CDKN1B mRNA expression, and enhanced the promotion effect of 3% sevoflurane on CDKN1B mRNA expression. *p < 0.05 vs. control or blank, **p < 0.01 vs. control or blank; #p < 0.05 vs. minmic control or inhibitor control, ##p < 0.01 vs. minmic control or inhibitor control; ^p < 0.05 vs. mimic or inhibitor, ^^p < 0.01 vs. mimic or inhibitor; △p < 0.05 vs. Mimic control + Sev3 or Inhibitor control + Sev3, △△p < 0.01 vs. Mimic control + Sev3 or Inhibitor control + Sev3.
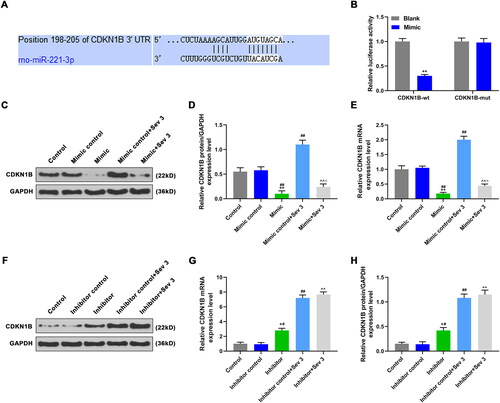
Figure 5. The effects of CDKN1B, siCDKN1B alone and combined with miR-342-5p on cell viability and apoptosis. A: Cell viability were detected by CCK-8, after transfection with mimic or/and CDKN1B. B: Cell viability were detected by CCK-8, after transfection with inhibitor or/and siCDKN1B. C: CDKN1B promoted apoptosis, reversed the effect of mimic on apoptosis. D: SiCDKN1B inhibited apoptosis, reversed the effect of inhibitor on apoptosis. E: The apoptosis rate in different groups was detected by flow cytometer. F: CDKN1B protein expression were detected by WB, after transfection with mimic or/and CDKN1B. G: CDKN1B increased CDKN1B protein expression, reversed the effect of mimic on CDKN1B protein expression. H: CDKN1B increased CDKN1B mRNA expression, reversed the effect of mimic on CDKN1B mRNA expression. I: CDKN1B protein expression were detected by WB, after transfection with inhibitor or/and siCDKN1B. J: SiCDKN1B decreased CDKN1B protein expression, reversed the effect of inhibitor on CDKN1B protein expression. K: SiCDKN1B decreased CDKN1B mRNA expression, reversed the effect of inhibitor on CDKN1B mRNA expression. CDKN1B, siCDKN1B, scramble negative controls, miR-342-5p inhibitor and miR-342-5p mimic were used for transfection, and divided into CDKN1B group, siCDKN1B group, NC group, inhibitor group, mimic group. And cells were co-transfected with miR-221-3p mimic and CDKN1B plasmid (mimic + CDKN1B group), as well as miR-221-3p inhibitor and siCDKN1B (inhibitor + siCDKN1B group). *p < 0.05 vs. control, **p < 0.01 vs. control; #p < 0.05 vs. NC, ##p < 0.01 vs. NC; ^p < 0.05 vs. mimic or inhibitor, ^^p < 0.01 vs. mimic or inhibitor; △p < 0.05 vs. CDKN1B or siCDKN1B, △△p < 0.01 vs. CDKN1B or siCDKN1B.
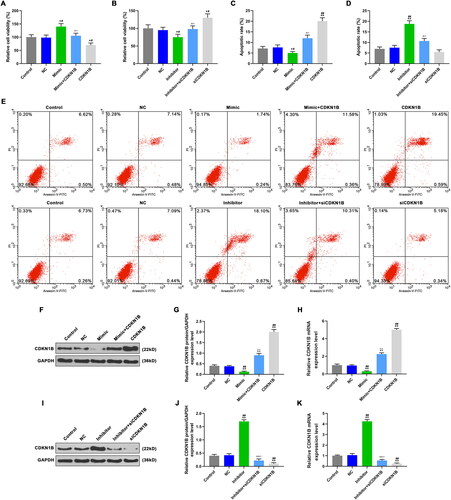
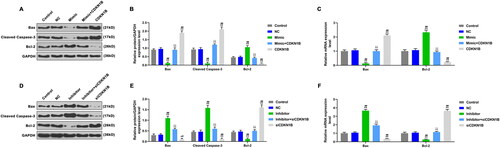
Figure 6. The effects of CDKN1B, siCDKN1B alone and combined with miR-342-5p on the expressions of apoptotic genes. A: The expressions of apoptotic genes were detected by WB, after transfection with mimic or/and CDKN1B. B: CDKN1B partially reversed the effect of mimic on apoptotic genes expressions. C: CDKN1B partially reversed the effect of mimic on the mRNA expressions of apoptotic genes. D: The expressions of apoptotic genes were detected by WB, after transfection with inhibitor or/and siCDKN1B. E: SiCDKN1B partially reversed the effect of inhibitor on apoptotic genes. F: SiCDKN1B partially reversed the effect of inhibitor on the mRNA expressions of apoptotic genes. *p < 0.05 vs. control, **p < 0.01 vs. control; #p < 0.05 vs. NC, ##p < 0.01 vs. NC; ^p < 0.05 vs. mimic or inhibitor, ^^p < 0.01 vs. mimic or inhibitor; △p < 0.05 vs. CDKN1B or siCDKN1B, △△p < 0.01 vs. CDKN1B or siCDKN1B.
Data availability statement
The datasets used and/or analyzed during the current study are available from the corresponding author on reasonable request.