
Figures & data
Table 1. Summarized results from common direct costs outcomes reported in studies by Bolge et al. [Citation52,Citation64,Citation65].a
Table 2. Summarized results from common indirect cost outcomes reported in studies by Bolge et al. [Citation52,Citation64,Citation65].a
Figure 1. PRISMA diagram of the systematic literature review.
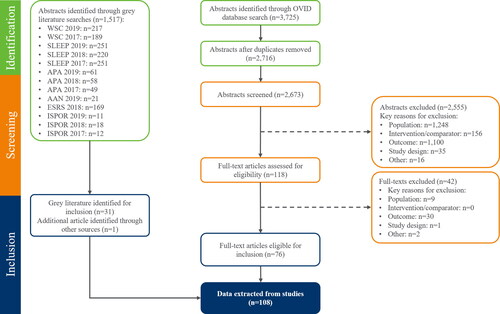
Figure 2. QoL (mean MCS and PCS scores) of patients with insomnia compared to good sleepers and the impact of using sleep medication.
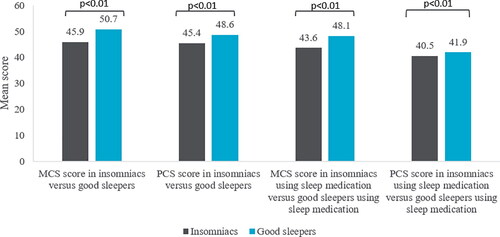
Figure 3. QoL of patients with comorbid insomnia and type 2 diabetes mellitus compared to those without insomnia.
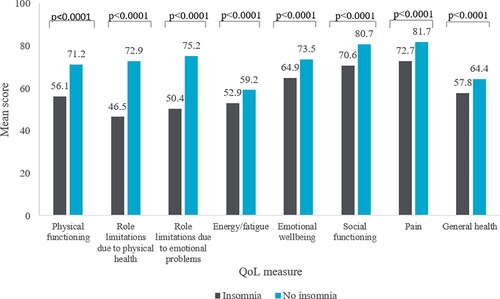
Figure 4. Geographic distribution of publications reporting data on off-label treatment of insomnia stratified by drug-class and region.
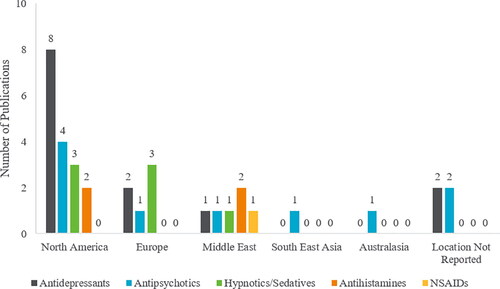
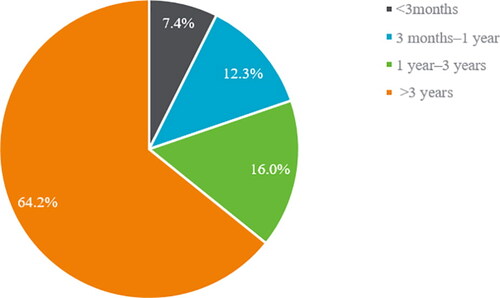
Figure 5. Duration of benzodiazepine use for patients with insomnia across six regions in Italy.
Supplemental Material
Download PDF (736.4 KB)Data availability statement
No new data were generated or analyzed in support of this research.