
Figures & data
Table 1. Patient demographics.
Figure 1. Application of rTMS on Ml of the contralesional hemisphere (a) and rPMS, (b) on EFM.
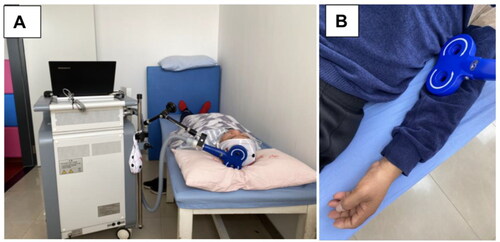
Figure 2. Grip strength (a) and pinch strength (b) was assessed by Elink comprehensive hand function test system.
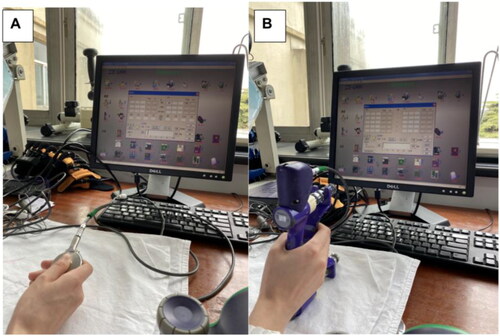
Figure 3. shows the muscle tone of EEM (a), EFM (b), WFM (c) and FD (d) before and after operation, and before and 15 days after rehabilitation. All the change trends of average MAS at four time points are decreased after surgery immediately, gradually increase till to rehabilitation, and then decrease again after rehabilitation.
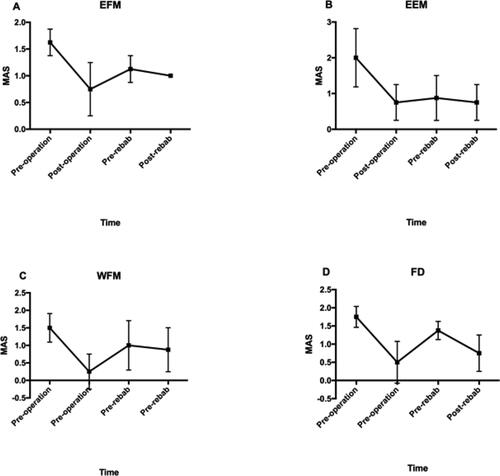
Table 2. Modified Ashworth Scale of ELM, EEM, WFM and FD before operation, after operation, before rehabilitation and 15 days after rehabilitation.
Table 3. NRS, Grip strength and pinch strength before and after rehabilitation.