Figures & data
Figure 1. Block arrangement problem and operational processes in shipyards.
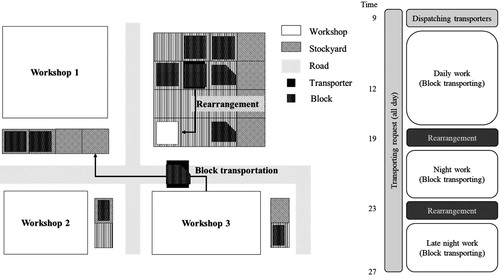
Figure 2. Decision processes in block stockyards arrangement problem.
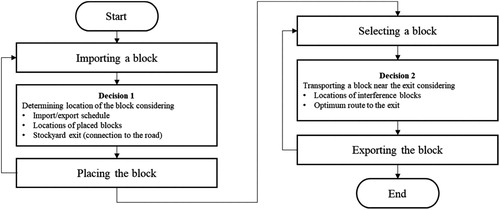
Table 1. Definitions of reinforcement learning components pertaining to the LA and TA.
Figure 3. Examples of (a) a grid and (b) rearrangement problem.
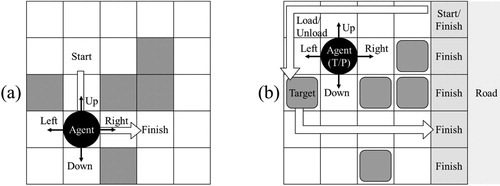
Figure 4. LA training process based on the A3C approach.
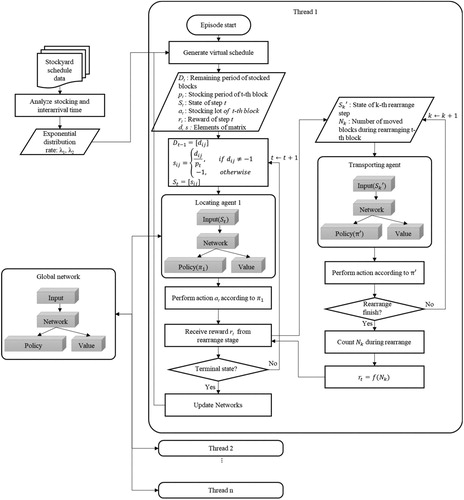
Figure 5. Geographical information and schematic drawing of the target stockyard.
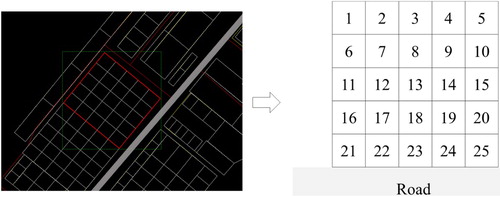
Figure 6. Episode length and reward during a training TA for 200,000 episodes.
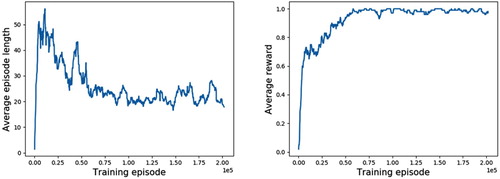
Figure 7. Failure rate and average number of moved blocks according to area occupancy ratio.
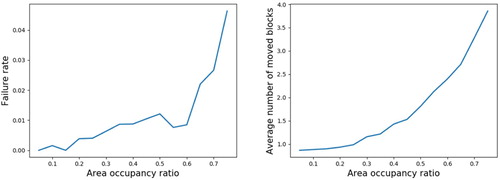
Figure 8. Examples of rearrangement process using the trained TA.
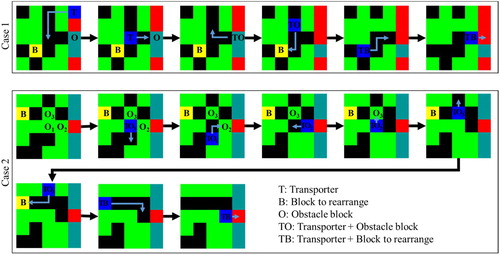
Figure 9. Histograms and probability distribution functions of arrangement period and interarrival time.
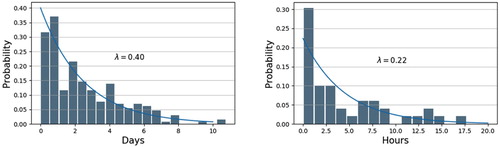
Figure 10. Episode length and reward during a training LA for 11,000 episodes.
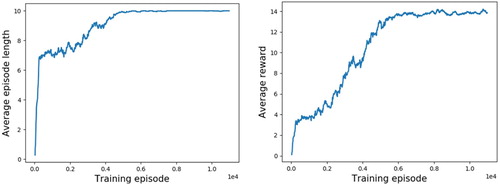
Figure 11. Example policy for the trained LA.
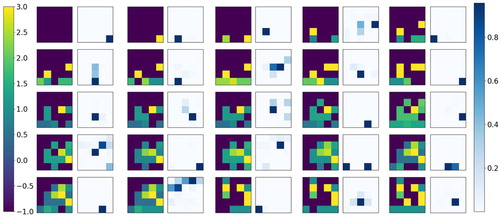
Figure 12. Schedule for a single block stockyard.
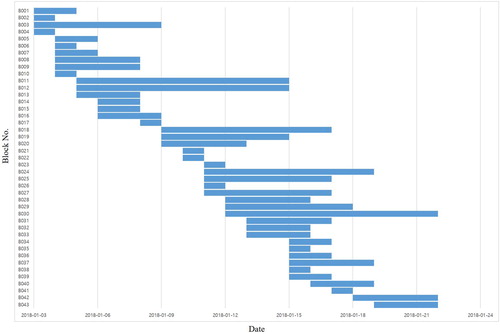
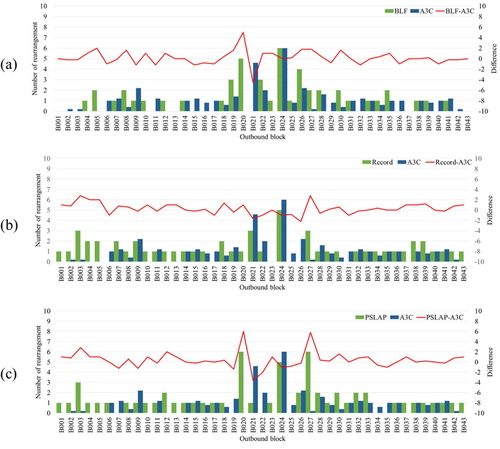
Figure 13. Comparison of rearrangement results obtained using (a) the A3C algorithm and the record data, (b) the A3C and BLF algorithms and (c) the A3C and PSLAP algorithms.