Figures & data
Figure 1. Example of the divergent and the serial networks.
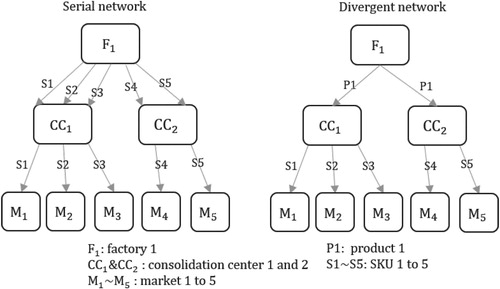
Figure 2. Four candidate optimal safety stock policies.
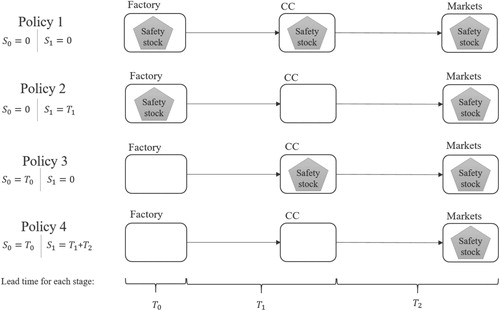
Table 1. Comparison of cost and lead time parameters of responsive and economic segment.
Table 2. Four scenarios: assumptions of the planning approaches and resulting network types.
Figure 3. Differentiation and standardisation levels of the four networks.
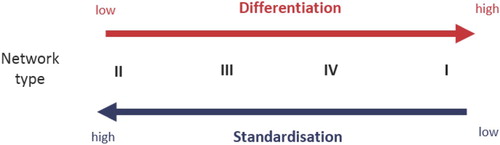
Table 3. Values in the datasets.
Table 4. The operating cost and the number of SKUs allocated to inventory and resource segments.
Table 5. The cost breakdown.
Figure 4. % increase in cost compared with Scenario IV.
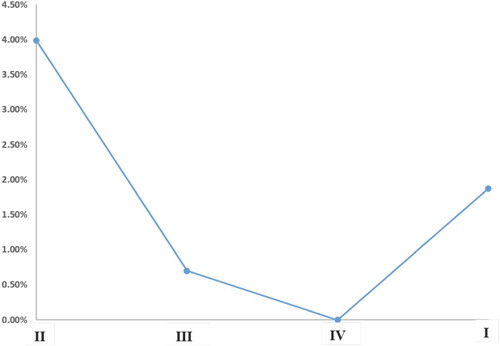
Figure 5. % increase in cost for Network I, II and III compared with cost for Network IV. (a) % increase in cost with respect to the % change of holding cost rate. (b) % increase in cost with respect to the % change of fixed cost in both modes. (c) % increase in cost compared with Scenario IV based on the both datasets and (d) % increase in cost compared with Scenario IV with segmented resources and single resource.
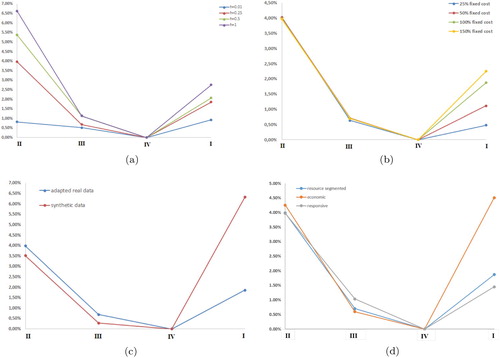
Table 6. Operating cost of a single resource segment in use compared with optimally segmented SC and allocations of resource (economic on the left and responsive on the right) and inventory segments for optimally segmented SC.
Figure 6. Total cost of product portfolios differing in number of products with identical SKU demands.
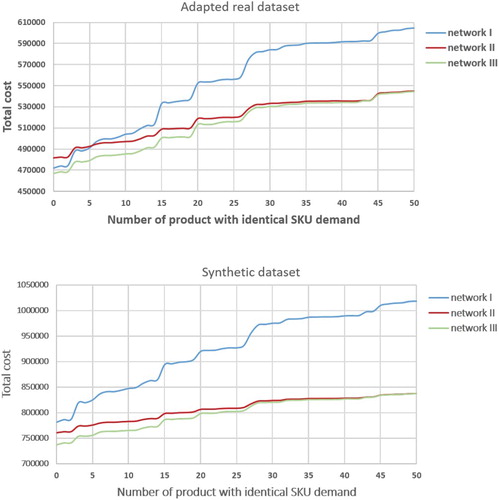
Table 7. % Cost saving from inventory pooling for mean product demand 1 m when supply chain is operated with optimal mode.
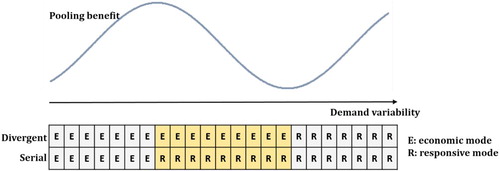
Figure 7. Graphic expression of pooling benefit in relation to optimal modes and demand variability.