Figures & data
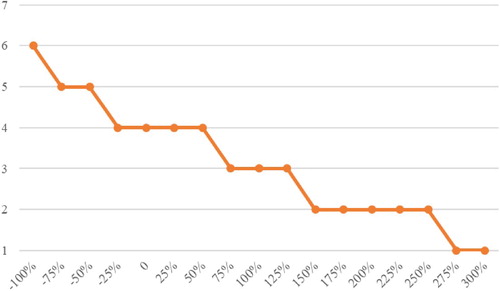
Figure 1. Supply and demand network with intermediate nodes.
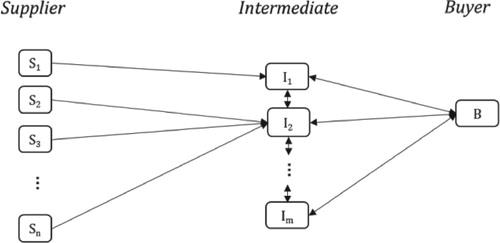
Figure 2. An example of buyers connections.
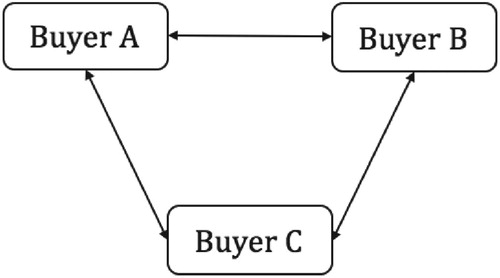
Figure 3. Graphic illustration of Dutch Food Valley.
Figure 4. Network structure.
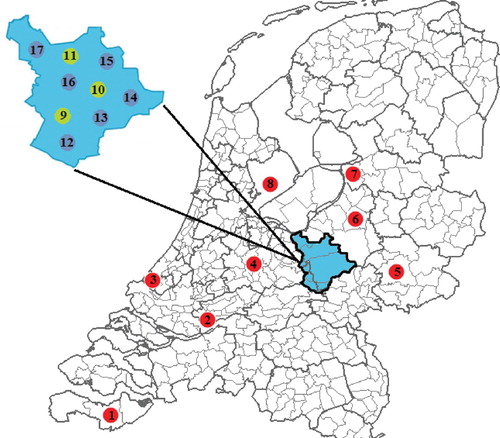
Table 1. Purchasing price and ordering cost per supplier.
Table 2. Demand for each buyer at each period.
Table 3. Relevant distances (per kilometre) between the different nodes in the network.
Table 4. Replenishment decisions for buyer 15.
Table 5. Replenishment decisions for buyer 16.
Table 6. Costs per buyer.
Figure 5. Network flow for buyers 15 and 16.
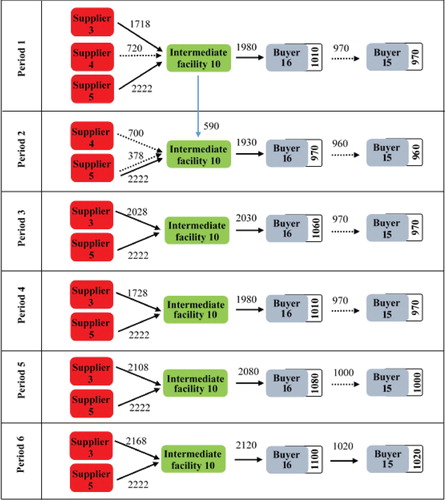
Table 7. Cost components.
Table 8. Costs per buyer.
Figure 6. Comparison of costs in collaborative and non-collaborative setting.
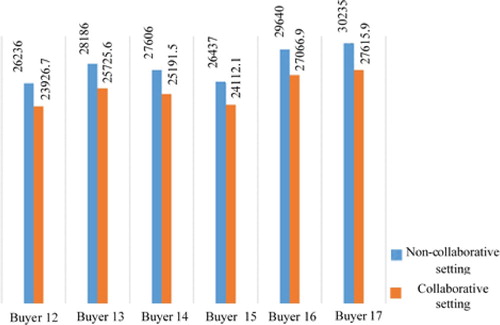
Table 9. Sensitivity analysis on transaction cost.
Figure 7. Sensitivity analysis on transaction cost.