Figures & data
Table 1. Summary of research performed to address tool-indexing problems.
Figure 1. Tool indexing on an 8-index turret magazine (Dereli and Filiz Citation2000).
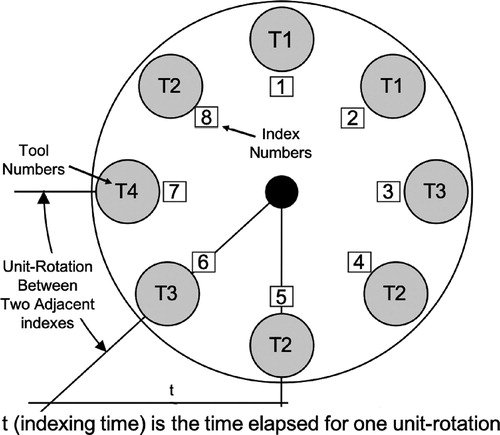
Figure 2. (a) Turret magazine with 45 index positions used in OP30; (b) schematic of OP30 turret.
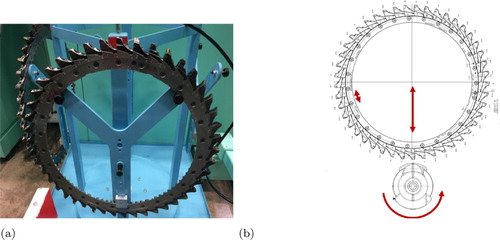
Table 2. OP30 operations with required tools and tool life (i.e. the number of crankshafts each tool can machine before complete wear out).
Figure 3. Factory-settings-based tool allocation on 45-index turret.
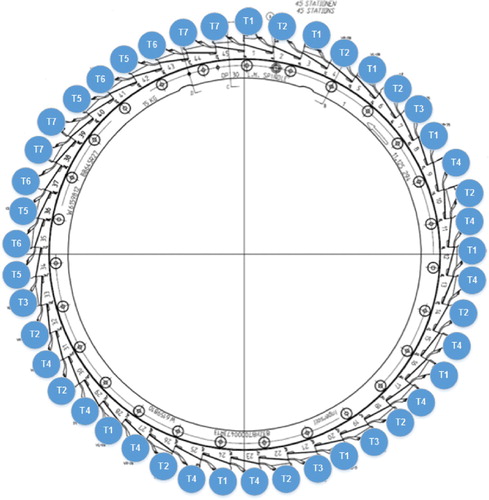
Table 3. Number of duplicates for each tool and magazine-index positions allocated to each tool based on the current factory settings.
Table 4. TIP sets and their definitions.
Table 5. TIP parameters and their definitions.
Table 6. TIP decision variables and their definitions.
Table 7. Operations with required tools and tool life (i.e. the number of parts each tool can machine before complete wear out).
Table 8. Number of duplicates for each tool and magazine-index positions allocated to each tool based on the settings illustrated in Figure .
Figure 4. Solutions in the objective space for the 8-index turret magazine solved by the mathematical model.
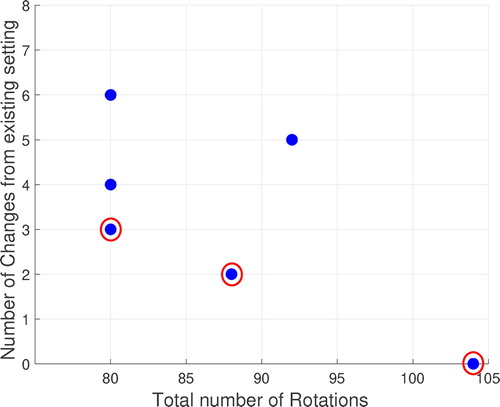
Figure 5. Flowchart of the SPEA2 algorithm.
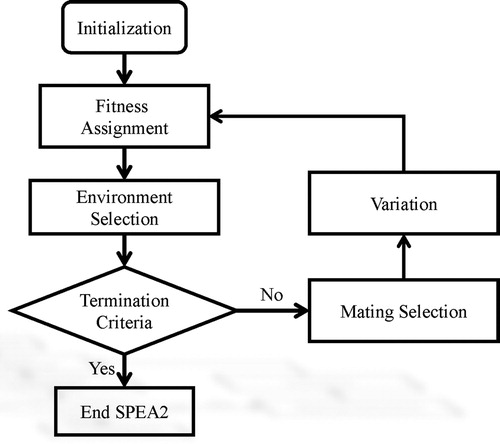
Figure 6. Solution representation of 8-index turret magazine depicted in Figure .
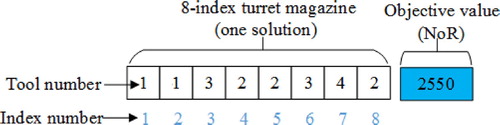
Figure 7. Solution representation of current tool-allocation strategy pertaining to the 45-index turret used in factories.
Figure 8. Calculating value of second objective function (NoC) for a random solution.
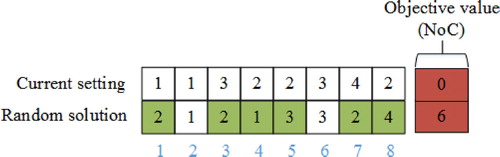
Figure 9. Illustration of environmental selection operator when the archive is too small (first scenario) for 45-index tool magazine with , and
: (a)
; i.e. the 16 non-dominated solutions shown in this figure are first copied to
; (b) missing NoC solutions and 22 solutions indicated by stars are added to
, thereby increasing archive size to
; (c) remaining
solutions are chosen from the best-dominated solutions in the multi-set
and added to the archive (indicated by diamonds); hence
.
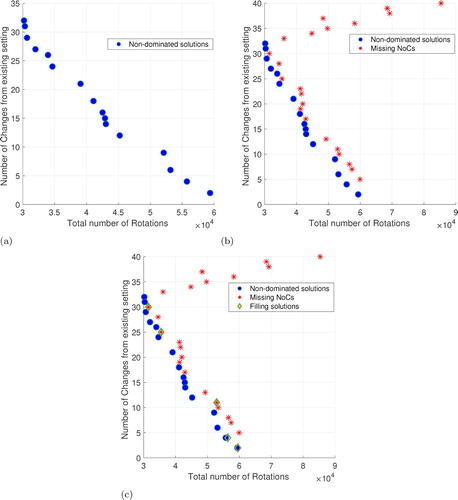
Figure 10. Customised crossover-repair operator used in the simple 8-index turret-magazine case described in Figure . (a) Best indexing route of the two parents is swapped. whilst maintaining other indexes constant. (b) Repair process for second offspring.
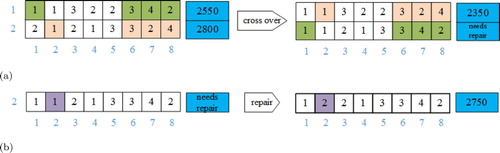
Figure 11. Mutation operation wherein index positions of the first instance of two random tools not participating in the crossover process are swapped to creating fitter offspring.
Figure 12. Two-hundred random initial solutions generated by executing an m-SPEA2 run.
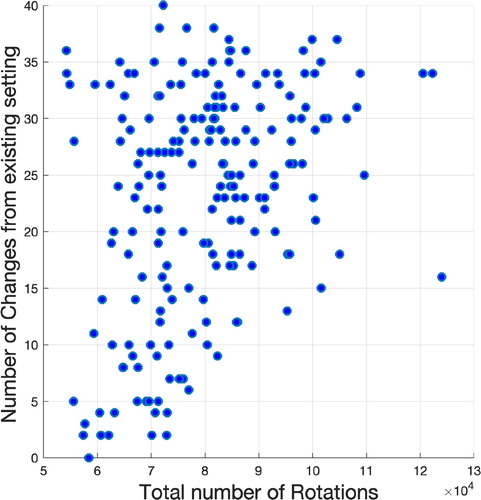
Figure 13. Hypervolume for minimisation of MOOP considered in this study with Nadir point as reference Amouzgar et al. (Citation2019).
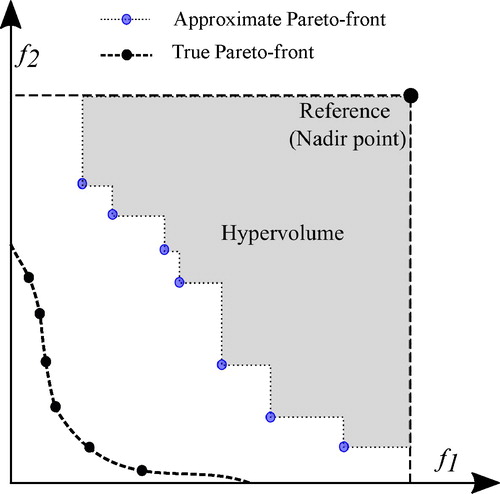
Figure 14. Non-dominated solutions in the objective space forming the Pareto front.
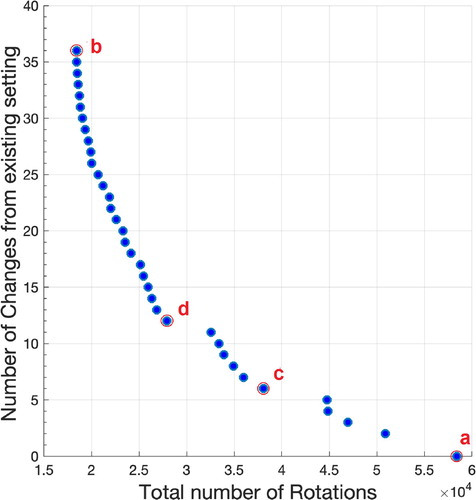
Figure 15. Tool allocation and improvement of non-machining time for 4 non-dominated solutions marked in Figure . Tool positions that remain unchanged compared to the current factory setting are marked by dark backgrounds. (a) solution a; (b) solution b; (c) solution c; (d) solution d.
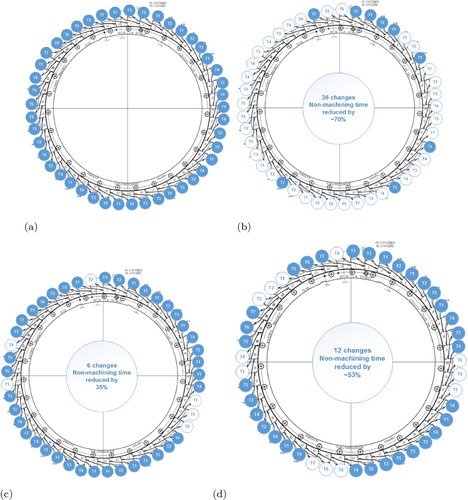
Table 9. Results for four different non-dominated solutions marked in Figure .
Figure 16. Number of unit rotations required to execute OP30 throughout the lifespan of 45-index turret magazine under two extreme solutions (marked by a and b in Figure ).
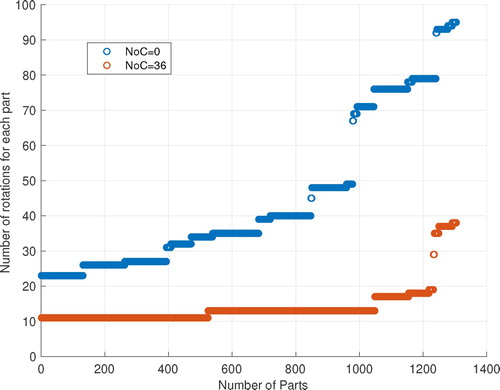
Figure 17. Non-dominated solutions in decision space illustrated as heat-map plot with each row representing a solution (optimum tool allocation). Small boxes represent magazine indexes, and tools placed at given index locations are marked by the tool number in the box. Triangles indicate similar tool-allocation sequences shared by several solutions.
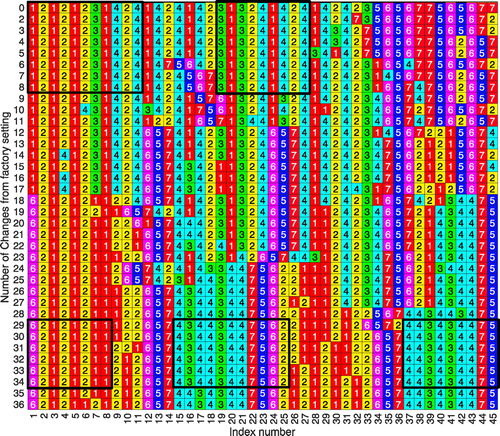
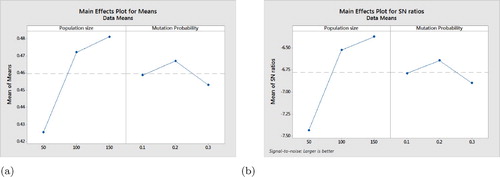
Table A1. Levels of m-SPEA2 parameters used in Taguchi design.
Figure A1. Plots obtained via Taguchi analysis for (a) Means; (b) SN ratio.