Figures & data
Figure 1. Example of two different scenarios for the realisation of the order fulfilment process after an initial allocation, where the only difference is in the order lead time (on the left, customer A orders first; on the right customer B orders first).
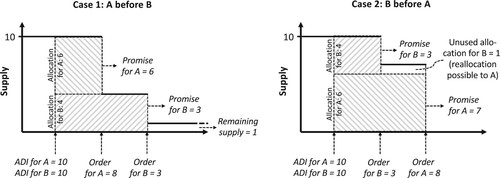
Figure 2. Rolling horizon scheme for customer ordering behaviour driven allocation planning.
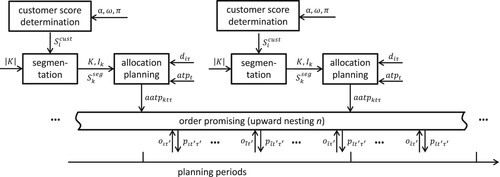
Table 1. Contract portfolios for numerical case study.
Table 2. On-time service levels per ADI accuracy error and number of customer segments.
Figure 3. (a) Relative difference in on-time service level by upward nesting level, (b) relative service level-optimal upward nesting level by error of ADI accuracy.
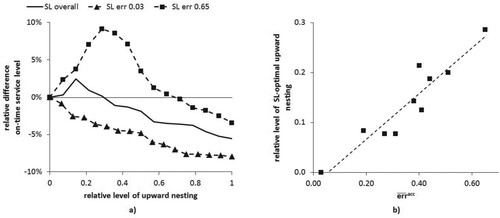
Figure 4. Average on-time service level performance of contract portfolios.
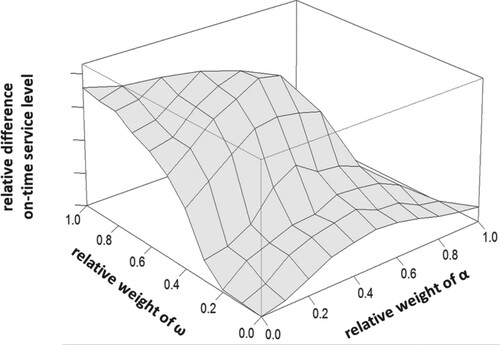
Table 3. Service-level-optimal weight factors.
Table 4. Impact of portfolio-specific parametrisation.
Table 5. The value of considering order lead time, ADI accuracy and profitability in demand fulfilment.
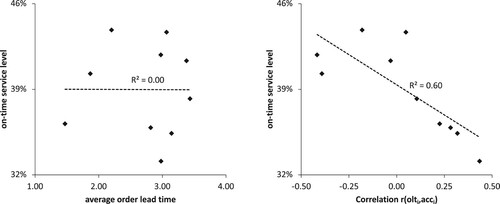
Figure 5. On-time service level in dependence of (a) the average customer order lead time; (b) the correlation of order lead time and advance demand information bias.