
Figures & data
Table 1. Studies related to emerging technology from the automotive industry.
Figure 1. Research Flow.
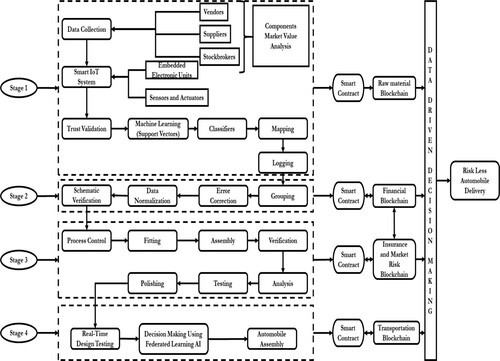
Figure 2. Components involved in Industry Grade Commercial Truck.
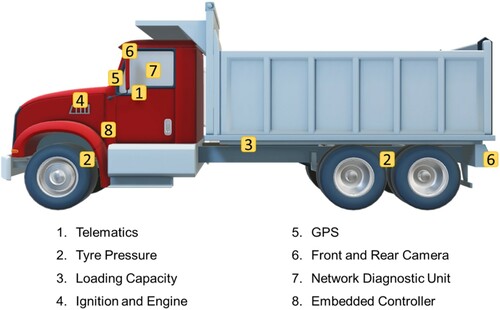
Table 2. Project charter.
Figure 3. Rendered Schematic Viewpoint for the Heavy-Duty Commercial Vehicle.
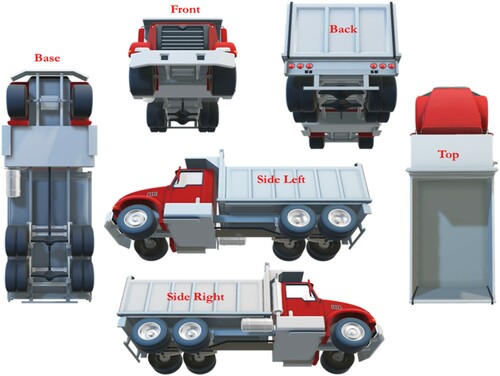
Figure 4. Automobile Assembly Model (AAM) using TTL, FAI, and Smart Contract Blockchain.
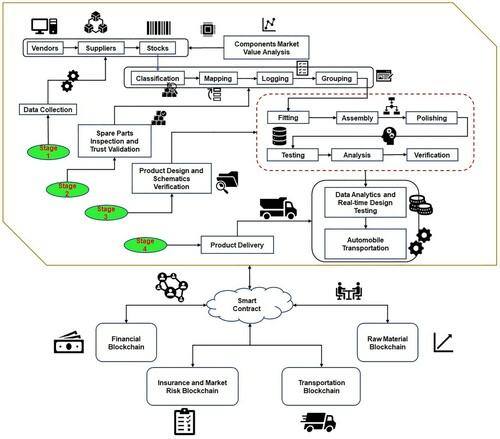
Table 3. Raw materials implemented with FAI training percentage and valuation index.
Table 4. Insurance type and gross margin % of different components in AAM design.
Table 5. Companies market valuations for each critical component in AAM design.
Table 6. Transportation tracking with delivery rate of all dealers in AAM design.
Table 7. Dealers revenue and gross sale improvisation using FAI, TTL, and SC during AAM design.
Figure 5. Data visualisation and results comparison (before & after implementing TTL & FAI).
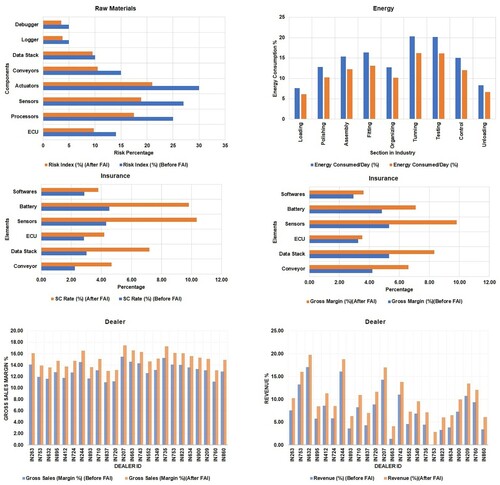
Table 8. Energy evaluation during AAM design, testing, and evaluation.
Data availability statement
The data that support this study is available from the corresponding author, Professor Lenny Koh ([email protected]) on request.