
Figures & data
Figure 1. A schematic representation of the whole sterilisation process with respective resources. Four symbols in order; the first, and third representing the resources, the other two are machines used in the SSD. One box above each symbol, with the text inside showing the label of that sterilisation step.
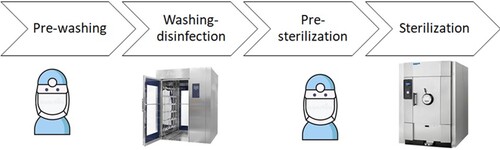
Table 1. Model notation.
Table 2. Input data for experiments.
Table 3. Base results.
Figure 2. Histogram of the simulated TIS. Histogram presenting the frequency of a certain TIS value among the simulation results.
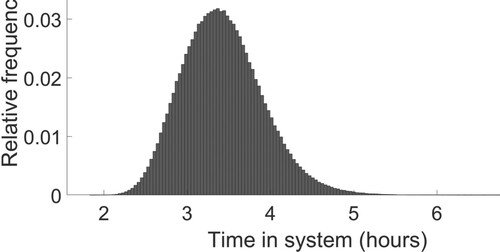
Figure 3. Histogram of the simulated MTIS. Histogram presenting the frequency of a certain MTIS value among the simulation results.
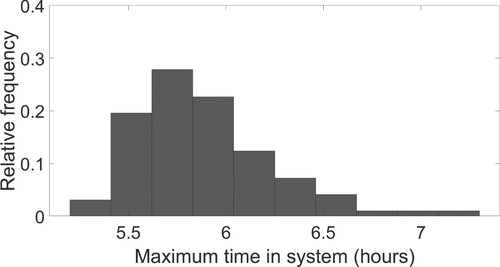
Table 4. Performance of the approximation on different cases.
Figure 4. Minimum cost obtained in different upper limits (hours) for TIS. A line plot where the x-axis ranges from 6 to 13 hours while the cost in y-axis ranges from around 150 to
1000.
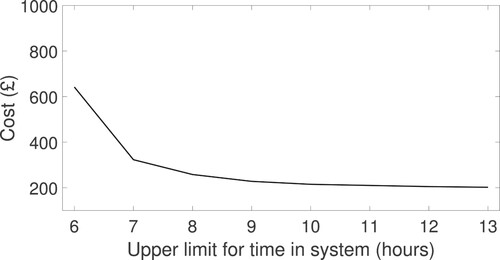
Figure 5. Minimum cost and capacities of sterilisation steps for various levels of arrival variation parameter. Three blocks and four line plots where x-axis represents the arrival variability levels of 1, 2, and 3. The first y-axis contains the cost that ranges between 0 and
1000, and the second y-axis contains the capacity levels between 0 and 40.
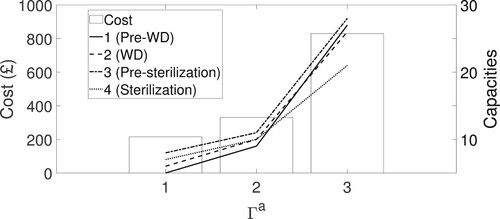
Figure 6. Minimum cost and total capacities of sterilisation steps for various levels of arrival rate. Several blocks and a line plot where x-axis represents the arrival rate between 4 and 9. The first y-axis contains the cost that ranges between 300 and
440, and the second y-axis contains the capacity levels between 35 and 50.
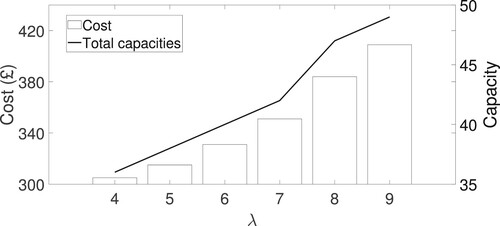
Figure 7. Minimum cost and capacities of sterilisation steps in different levels of service variations of steps 1 & 3. Three blocks and four different types of pointers in three different service variation levels. The first y-axis contains the cost that ranges between 0–1000, and the second y-axis contains the capacity levels between 0 and 50.
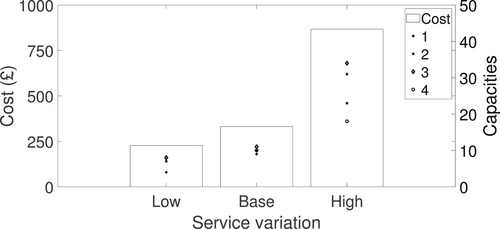
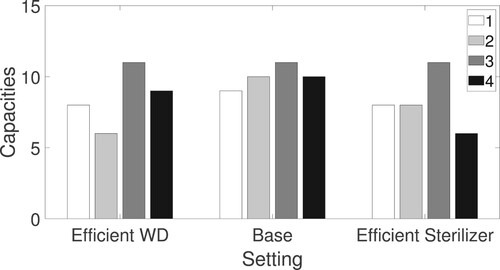
Figure 8. Capacities of sterilisation steps for WD and sterilisation machines with different efficiency and cost. Three x-axis ticks and four different coloured blocks for each x-axis tick, while the y-axis contains capacities ranging from 0 and 15.
Data availability statement
The data that support the findings of this study are available from the corresponding author, [EG], upon reasonable request.