
Figures & data
Figure 1. Control volume considered to develop this study (within the dashed rectangle).
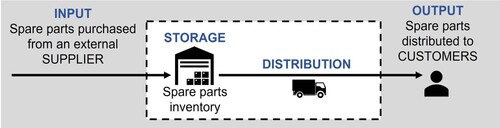
Figure 2. Schematic representation of the five SC configurations considered. equal to 0 corresponds to a decentralised SC configuration,
equal to 1 is a centralised configuration, and the values in between are hybrid SC configurations. The picture considers an example of a two-echelon SC serving six customers.
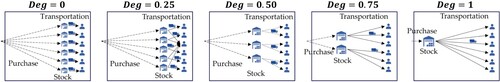
Figure 3. Matrix of the spare parts SC designs considered in the DSS.
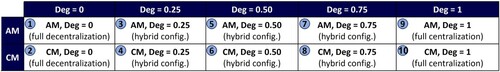
Table 1. Input parameters for the mathematical model.
Table 2. Parameters and values of discretised parametric analysis.
Table 3. Values considered in the Sobol-based parametric analysis. The range extreme values are based on Table .
Figure 4. Results of the ANOVA (Main Effects Plots) for the optimal SC design.
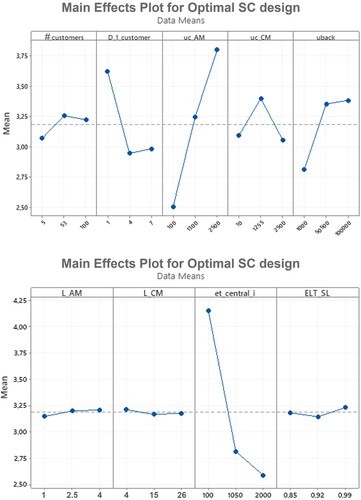
Figure 5. Sensitivity analysis on the accuracy () of the decision tree.
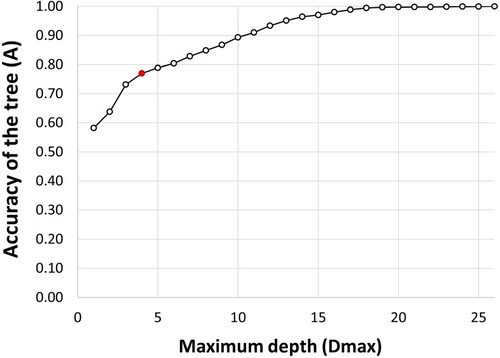
Figure 6. Decision tree with a maximum depth of 4 levels ().
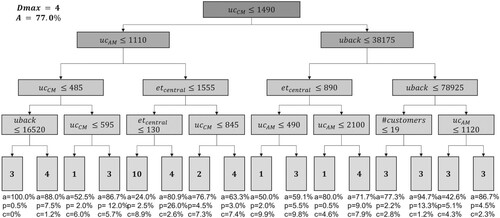
Figure 7. Relative importance of the independent parameters on the decision of the optimal SC design.
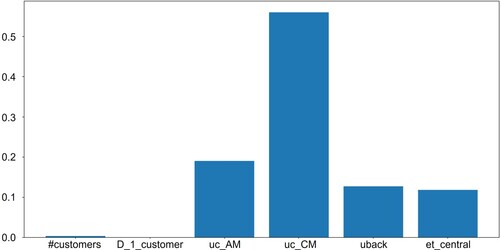
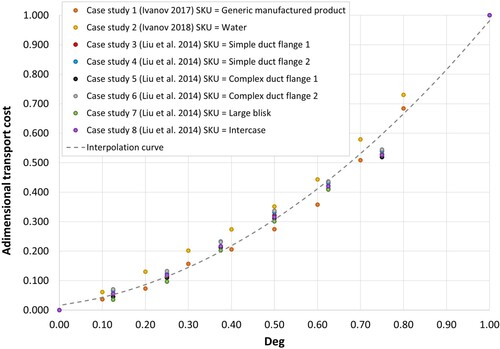
Figure A1. Relationship between centralised and decentralised transportation costs.
Supplemental Material
Download MS Word (46.6 KB)6. Data availability statement
The authors confirm that the data supporting the findings of this study are available within the article [and/or] its supplementary material.