
Figures & data
Figure 1. Two OPP instances. (a) A single-block warehouse with 6 aisles each with 16 time-unit length and 11 picking locations. (b) A three-block warehouse with 8 aisles each with 16 time-unit length and 25 picking locations (Çelik and Süral Citation2019).
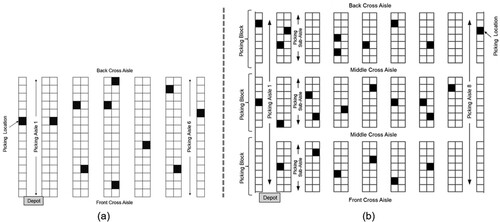
Figure 2. The graph representations of Figure (a) and (b) (Çelik and Süral Citation2019).
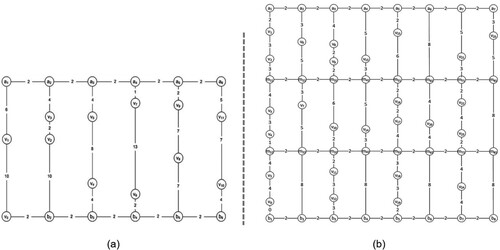
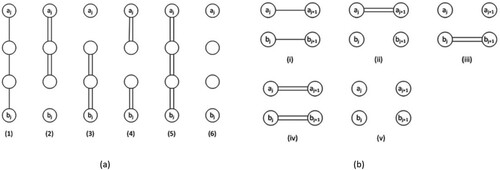
Figure 3. (a) Possible intra-aisle connection types, (b) Possible inter-aisle connection types.
Table
Table
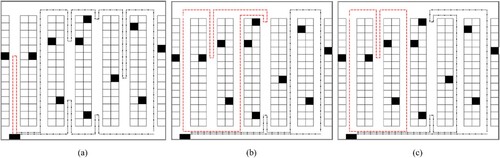
Figure 4. The minimum time solutions for the example in Figure (a). (a) VRP-MINSUM, (b) VRP-MINMAX and two-picker OPP algorithm, (c) initial phase of the two-picker dynamic zone-picking heuristic.
Table
Table
Figure 5. Visual representation of 6-aisle picking area zone-assignment.
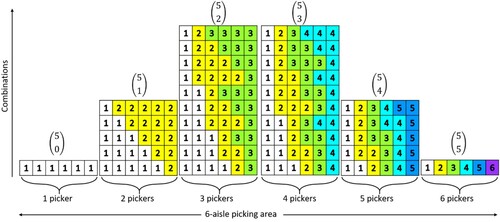
Figure 6. Binomial expansion of 6-aisle picking area zone-assignment.
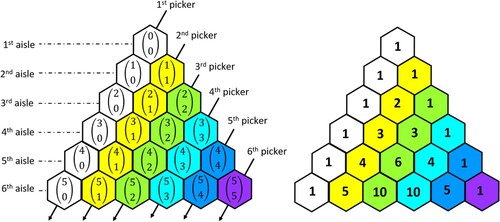
Figure 7. The pathways of 10 possible zone configurations for 6 aisles and 3 pickers.
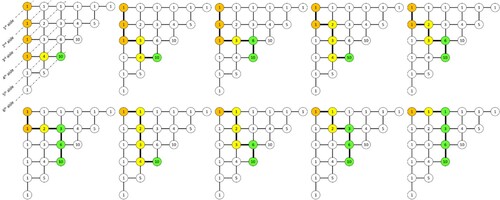
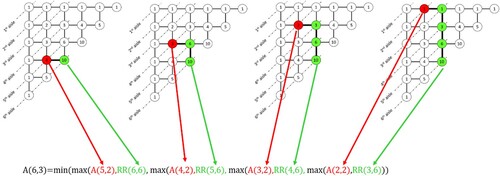
Figure 8. Visual representation of Algorithm 3.
Table
Figure 9. Resulting 3-picker heuristic solutions for the instance in Figure (b). (a) S-shape heuristic solution. (b) Largest gap heuristic solution. (c) Aisle-by-aisle heuristic solution. (d) Combined heuristic solution.
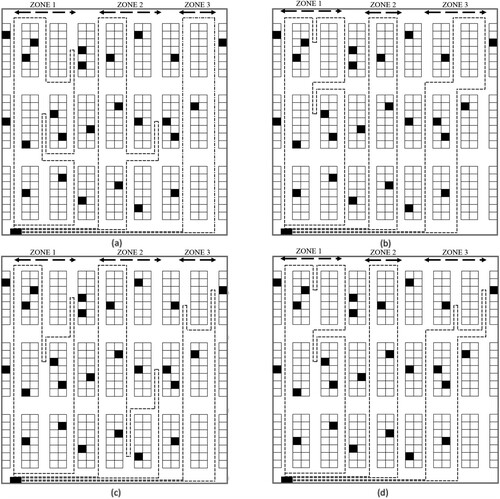
Table 1. Summary of the computational experiments.
Figure 10. Impact of number of pickers on lead time reduction.
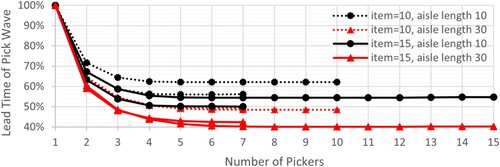
Figure 11. Impact of number of pickers on lead time reduction with Scholz et al. (Citation2016) instances.
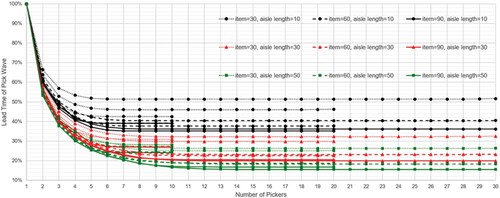
Table 2. Gap analysis between zone-picking and no zone-picking cases.
Table 3. Minimum wave-picking lead times with each additional picker for multi-block layout settings.
Table 4. Percentage savings with each additional picker for multi-block layout settings.
Data availability statement
There are no restrictions on sharing of the data in this paper due to data ownership or the inclusion of personally identifiable information. All data is available upon request from the authors.