
Figures & data
Figure 1. Proposed architecture for Industrial Internet of Things-enabled digital servitization in smart production logistics.
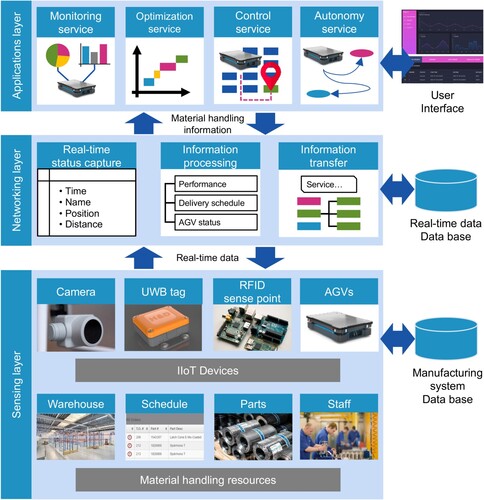
Figure 2. Proposed data model for multichannel communication in Industrial Internet of Things-enabled digital servitization for smart production logistics.
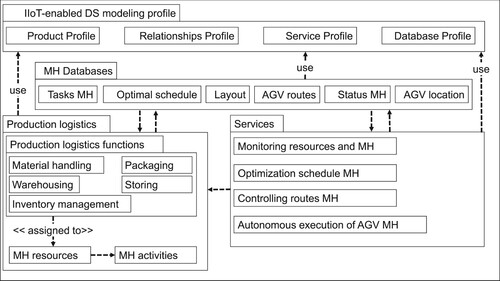
Figure 3. Proposed industrial internet of things digital servitization for smart production logistics function profile.
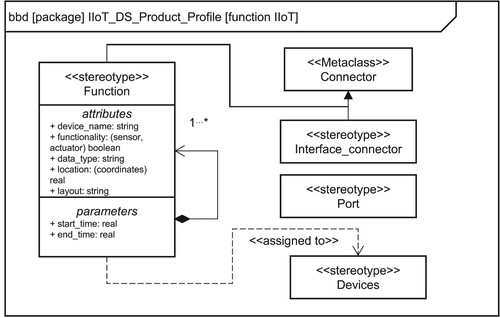
Figure 4. Proposed industrial internet of things digital servitization for smart production logistics database profile.
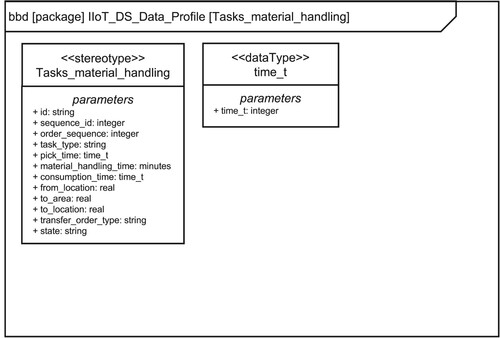
Figure 5. Monitoring, optimisation, control, and autonomy services in material handling for the Industrial Internet of Things-enabled digital servitization for smart production logistics.
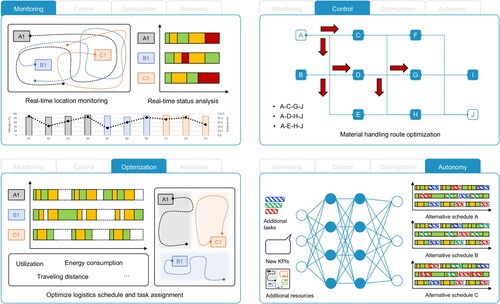
Figure 6. Proof-of-concept prototype in a laboratory environment.
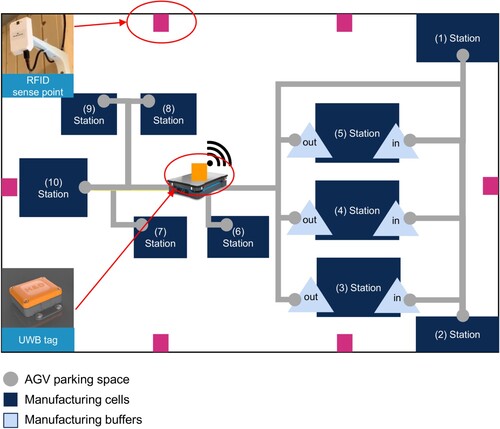
Figure 7. Screenshot of the monitoring service for material handling for the proof of concept.
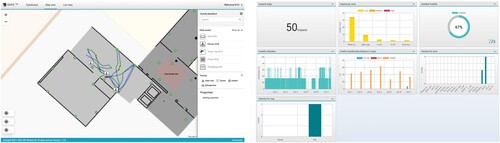
Figure 8. Screenshot of the control service in the proof of concept.
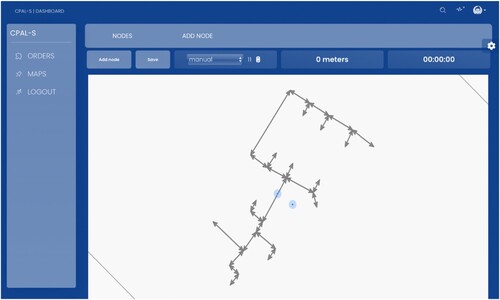
Figure 9. Screenshot of the autonomy services in the proof of concept utilising MiR software.
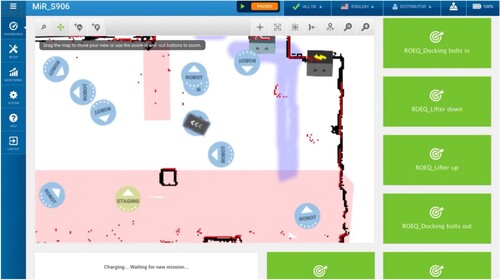
Figure 10. Results from the data-drive optimal schedule of material handling tasks in smart production logistics.
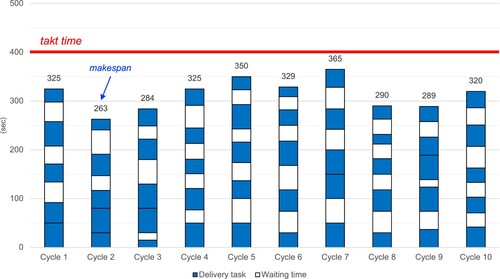
Table A1. Notations for optimisation model.
Table A2. Position of stations in proof-of-concept prototype in a laboratory environment.
Table A3. Tasks for material handling in the proof-of-concept.
Table A4. Optimal results of data-driven dynamic optimisation of tasks in material handling (VA: value added task, NVA: non value added task).
Figure A1. Industrial Internet of Things digital servitization for smart production logistics device profile.
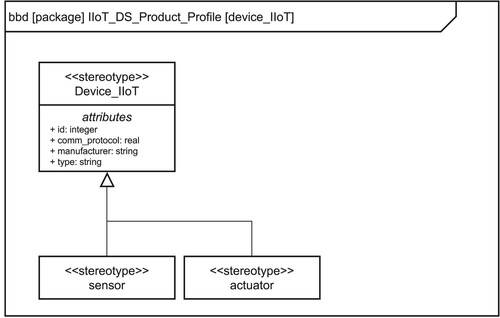
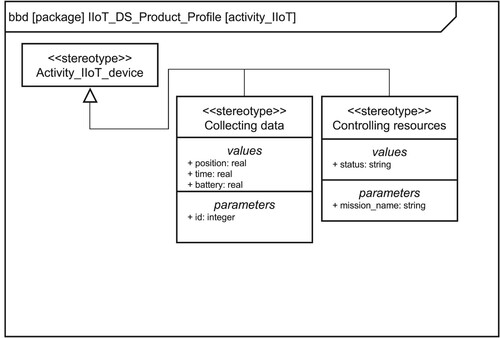
Figure A2. Industrial Internet of Things digital servitization for smart production logistics activity profile.
Data availability statement
The data that support the findings of this study are available from the corresponding author, Erik Flores-García ([email protected]), upon reasonable request.