
Figures & data
Table 1. Classification of Demand Class.
Figure 1. Promising current orders in the push-pull based ATP model.
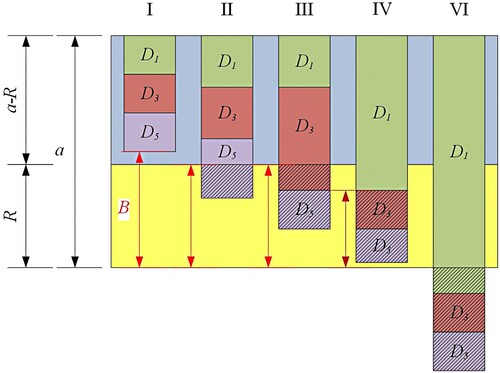
Figure 2. Promising current orders in the pull-based ATP model.
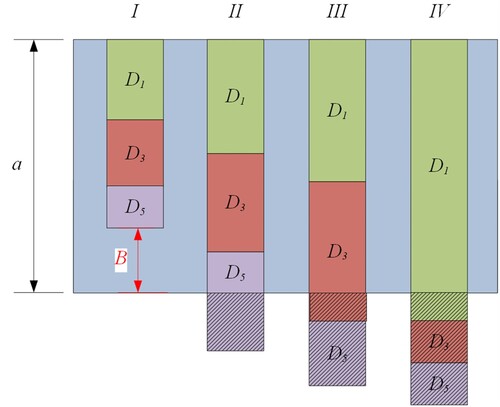
Figure 3. Promising future customer orders (with given remaining critical resource b).
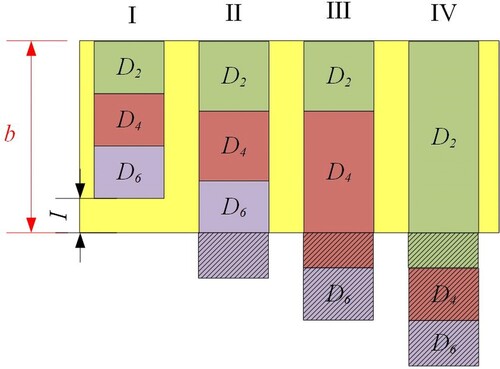
Table 2. Characteristics of Demand Classes
Figure 4. Best fitness value in each generation versus iteration number.
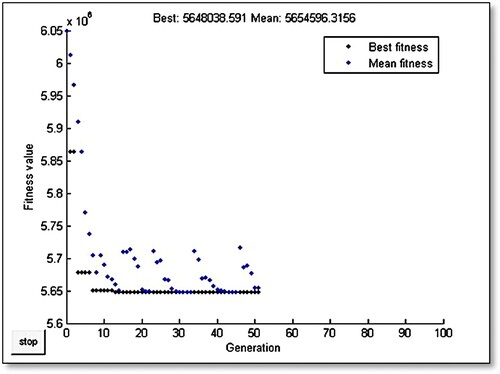
Figure 5. Impact of dynamic resource reservation policy.
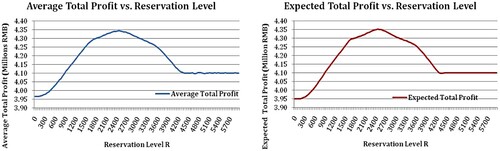
Figure 6. Impact of initial availability on reservation level (for low availability scenarios).
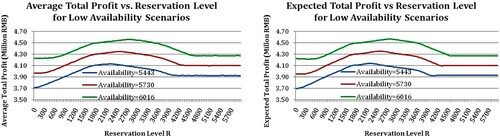
Figure 7. Impact of initial availability on reservation level (for high availability scenarios).
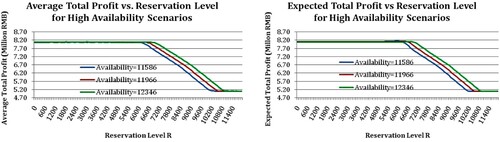
Figure 8. Impact of per-unit denial penalty cost of different ratio levels on reservation level.
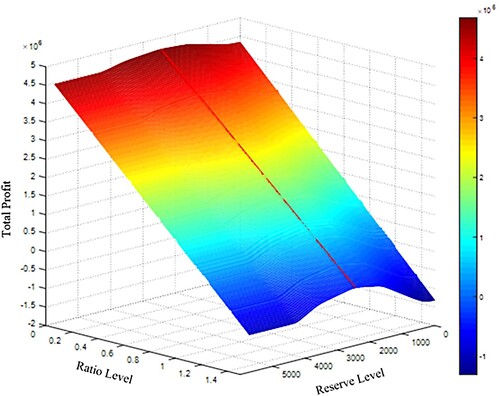
Figure 9. Impact of per-unit denial penalty cost with the same value on the reservation level.
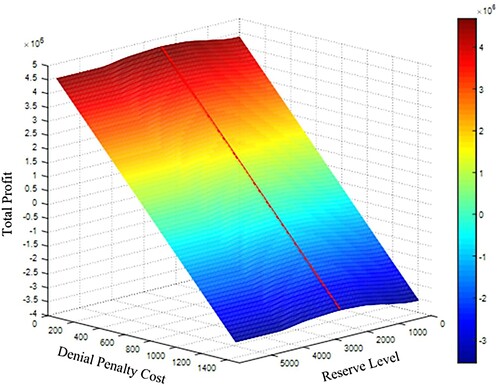
Figure 10. Impact of per-unit denial penalty cost of class 1 on reservation level.
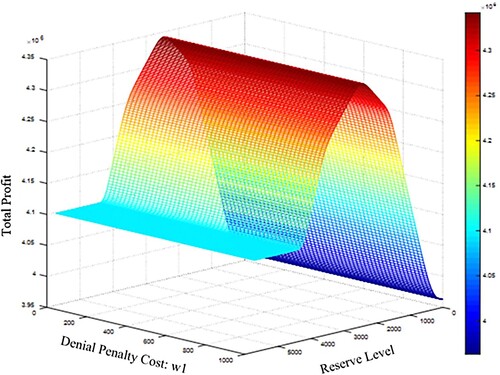
Figure 11. Impact of per-unit denial penalty cost of both class 1 and class 2 on reservation level.
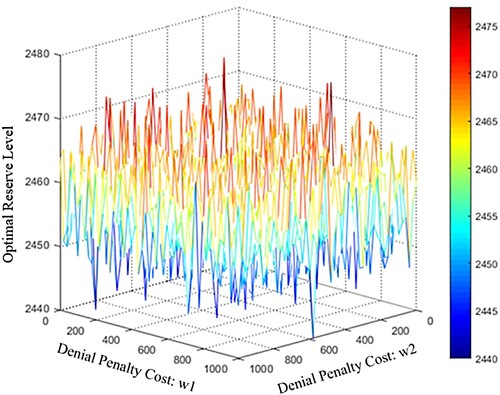
Figure 12. Impact of inventory holding cost g and h on reservation level.
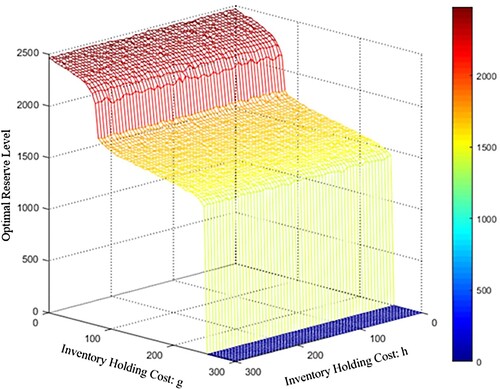
Figure 13. Impact of future pricing level on the total profit.
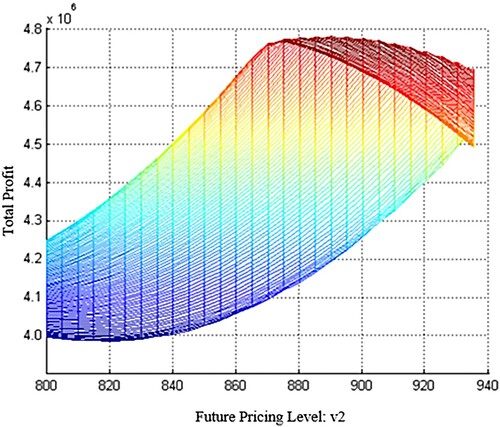
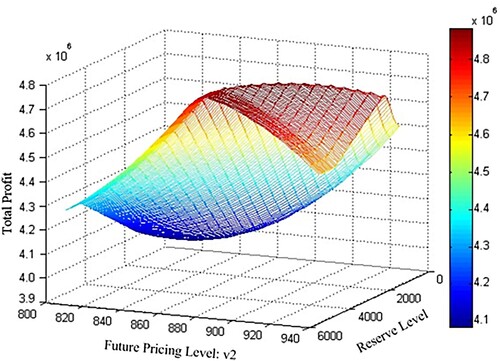
Figure 14. Impact of future pricing level on the reservation level and total profit.
Data availability statement
The data that support the findings of this study are available from the corresponding authors, W.Q. and Y. L., upon reasonable request.
Acknowledgements
The authors would like to acknowledge the financial support of the National Natural Science Foundation of China (No. 51775348).