
Figures & data
Figure 1. View from the front and top on a rack in a triple-deep AS/RS (Lehmann and Hußmann Citation2022).
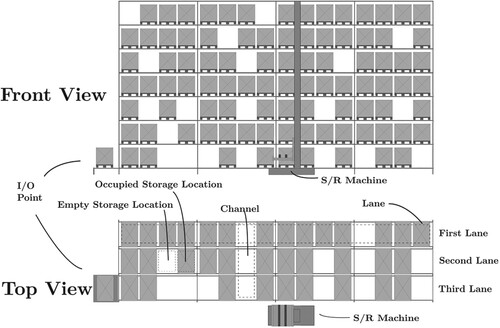
Table 1. Notation for the travel time calculation in this work.
Table 2. Abbreviations used in this work.
Figure 2. The three possible storage operations in a triple-deep AS/RS (Lehmann and Hußmann Citation2022).
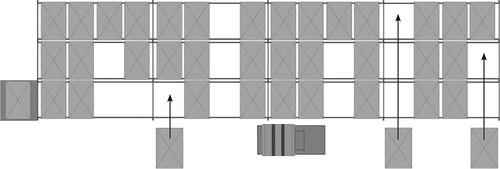
Figure 3. The six possible retrieval operations in a triple-deep AS/RS (Lehmann and Hußmann Citation2022).
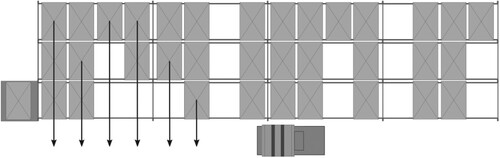
Figure 4. Markov chain of the triple-deep AS/RS (Lehmann and Hußmann Citation2022).
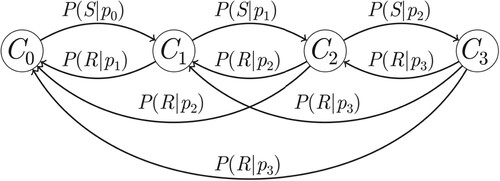
Figure 5. Example of the top view of a rack in a triple-deep AS/RS with a minimal variance strategy (Lehmann and Hußmann Citation2022).
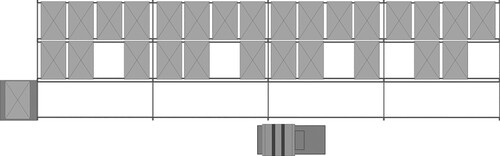
Table 3. Input parameters for the simulation. ,
,
,
,
are obtained from Marolt, Kosanić, and Lerher (Citation2022). The other parameters are based on the existing AS/RS and AVS/RS.
Figure 6. Relocation probabilities for the example AS/RS for the four strategies and the relative error between the simulation and the analytic model (Lehmann and Hußmann Citation2022).
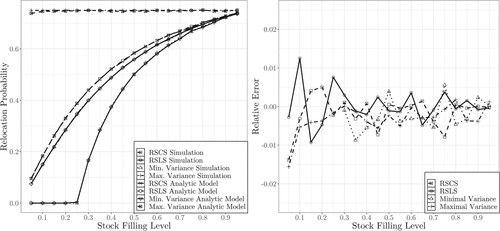
Figure 7. Relocation quantities β for the example AS/RS for the four strategies and the relative error between the simulation and the analytic model (Lehmann and Hußmann Citation2022).
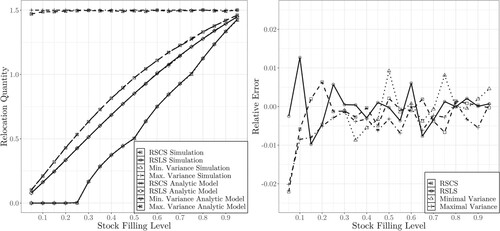
Figure 8. Travel time for the example AS/RS for the four different strategies and the relative error between the simulation and the analytic model (Lehmann and Hußmann Citation2022).
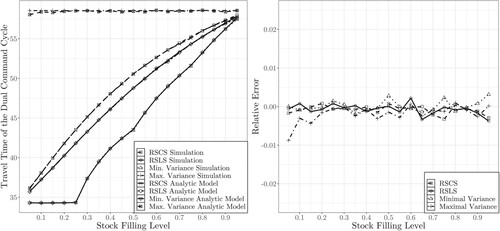
Figure 9. Analytically derived channel state probabilities for a 4-deep AS/RS and the RSCS and RSLS strategies (Lehmann and Hußmann Citation2022).
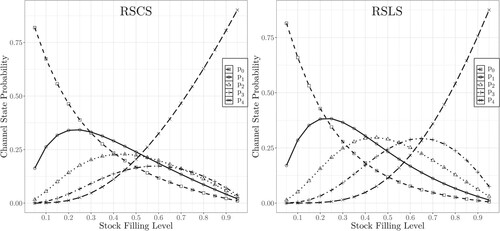
Table 4. Relocation probability and quantity β for AS/RS with depth n = 2, n = 3, n = 4 and n = 5 and the RSCS and RSLS strategies for z from
to
and
.
Table 5. Relocation probability and quantity β for AS/RS with depth n = 2, n = 3, n = 4 and n = 5 and the Minimal Variance and Maximal Variance strategies for z from
to
and
.
Data availability statement
The data that support the findings of this study are available from the corresponding author, Timo Lehmann, upon reasonable request (Lehmann andHußmann Citation2022).