
Figures & data
Figure 1. Neural network.
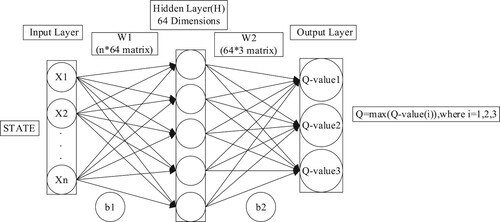
Figure 2. DQN model.
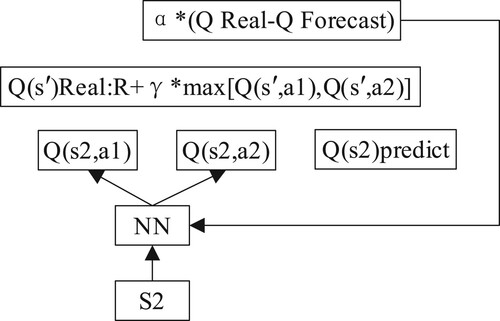
Table 1. DQN algorithm flow table.
Figure 3. Intelligent manufacturing cotton blending optimisation of a big-data-driven matching model based on deep RL.
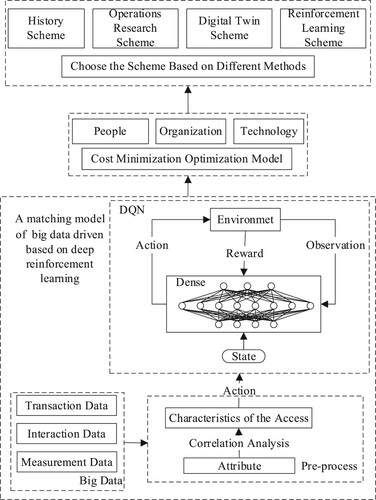
Table 2. 60 and 80 yarns before and after adjustment variables and average cotton usage (After adjustment and Before adjustment).
Table 3. Parameters used in the experiment.
Figure 4. Stock return prediction results.
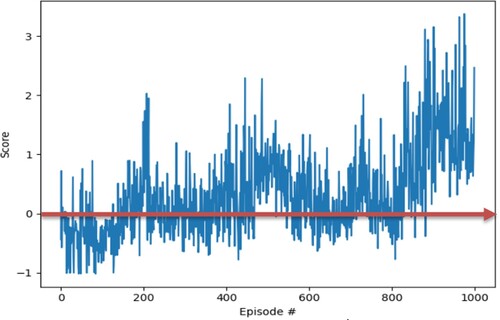
Figure 5. Stock buying and selling chart.
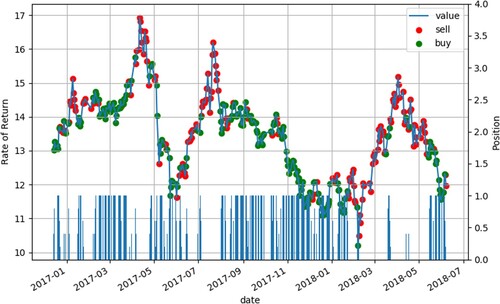
Figure 6. The smoothness of the stock data set.
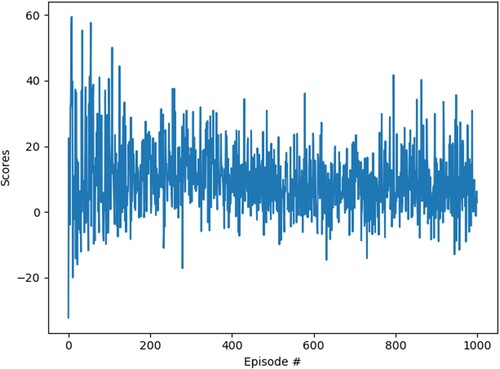
Table 4. Returns compared with other recent papers.
Figure 7. The loss values of the stock data set.
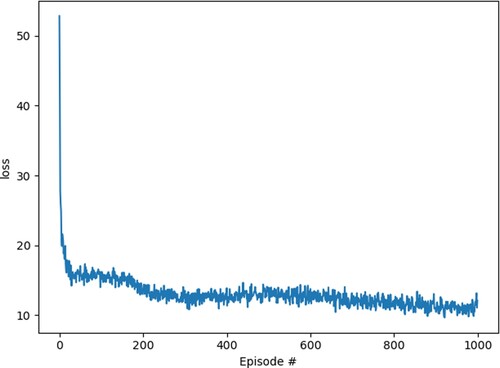
Figure 8. Robust test of stock return prediction results.
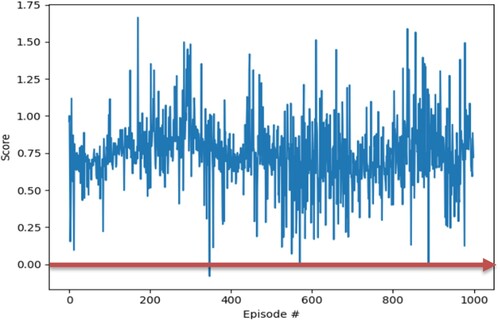
Figure 9. Cotton blending experiment results.
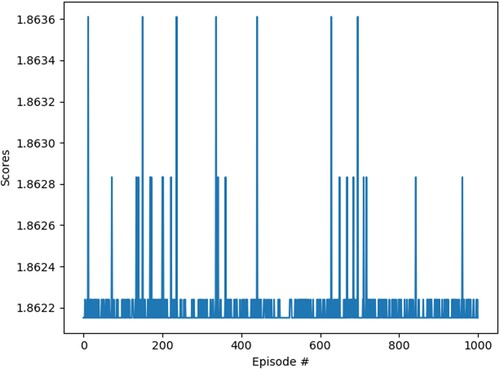
Figure 10. Performance evaluation of cotton blending model.
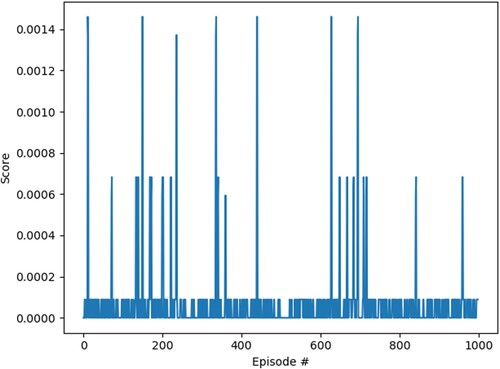
Table 5. Optimal cotton blending scheme and price comparison of different cotton blending schemes before and after adjustment.
Data availability statement
The authors confirm that the data supporting the findings of this study are available within the article and its supplementary materials.