
Figures & data
Figure 1. Illustration of calculating the costs of removing node b from route r and inserting node e at position 5 in route r. Route r is marked with solid lines and the insertion and removal with dotted lines.
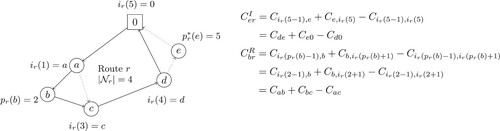
Figure 2. A route consisting of the depot and nodes a, b, c and d is changed to a route consisting of the depot and nodes b, d and e. The cost of the route is then changed from to
.
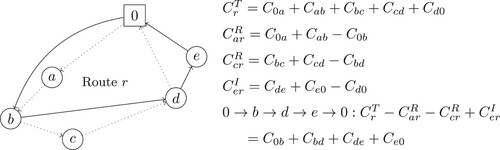
Table 1. An overview of all solution methods for the PRP.
Table 2. The number of instances solved by each solution method.
Table 3. Parameter values.
Table 4. The average results for the Adulyasak instances.
Table 5. The average gaps in percentage for the Archetti instances.
Table 6. The number of best-known solutions (BKSs) for the Archetti instances.
Table 7. The average computing time in seconds for the Archetti instances.
Table 8. The average gap in percentage for the Boudia instances.
Table 9. The number of best-known solutions (BKSs) for the Boudia instances.
Table 10. The average computing time in seconds for the Boudia instances.
Table 11. The average gap in percentage for the IRP.
Table 12. The number of best-known solutions (BKSs) for the IRP.
Table 13. The average computing time in seconds for the IRP.
Table 14. The reduction in solution quality, given in percentage, if different components of the matheuristic are removed.
Data availability statement
The data that support the findings of this study are openly available at http://axiomresearchproject.com/publications/.