
Figures & data
Table 1. Human-related aspects used in this paper related to terms in previous research.
Figure 1. The adapted HTO model used in this paper.
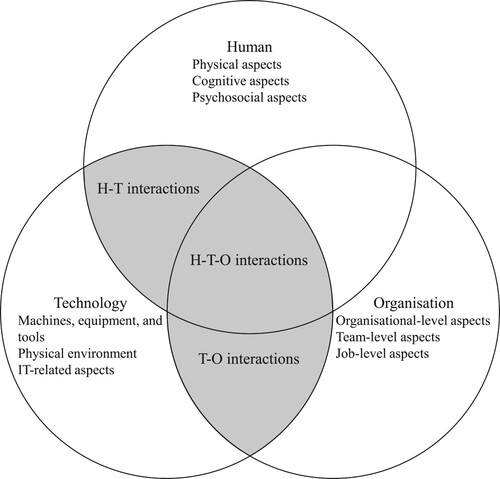
Table 2. Overview of interviews and shop floor visits conducted for the paper.
Figure 2. Organisational structure surrounding the AGV in case 1.
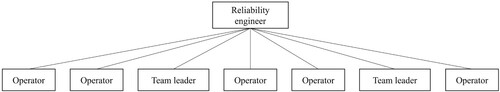
Figure 3. Organisational structure surrounding the AGVs in case 2.
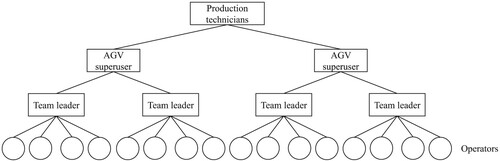
Figure 4. Challenges in the interaction between human and technology.
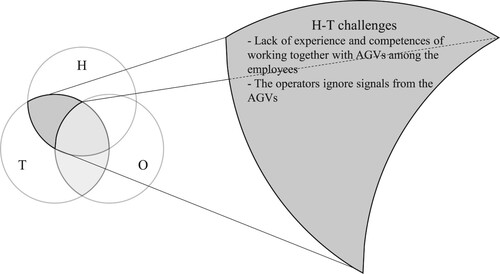
Figure 5. Challenges in the interaction between technology and organisation.
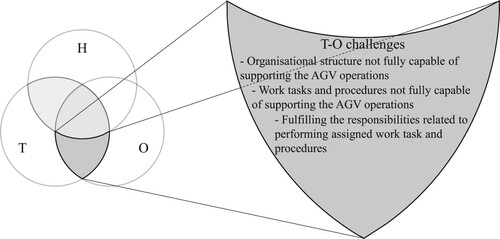
Figure 6. Challenges in the interaction between human, technology, and organisation.
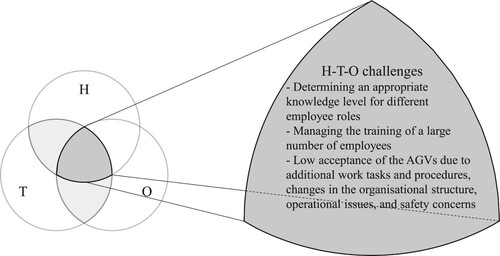
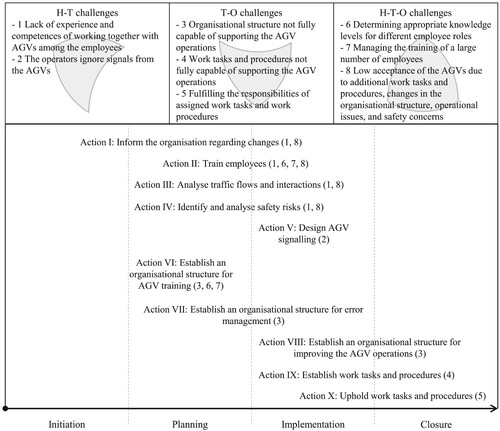
Figure 7. The proposed actions are connected to the phases of a project, indicating when a certain action could be relevant to perform during the introduction of AGVs.
Data availability statement
The data supporting the findings of this study are available in the article and the research database of the study. The case companies do not wish to make it freely available.
