
Figures & data
Table 1. Summary and classification of the literature review.
Figure 1. Proposed Multi-Period Combined Maintenance and Routing (MPCMR) model.
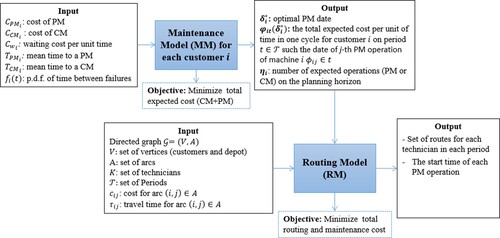
Figure 2. Sample maintenance cycles with preventive and corrective maintenance operations (E. López-Santana et al. Citation2016).
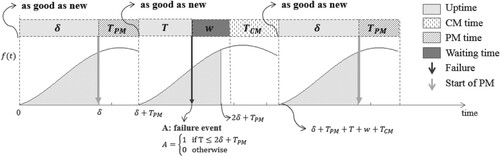
Figure 3. Total maintenance policy cost, PM, and CM cost.
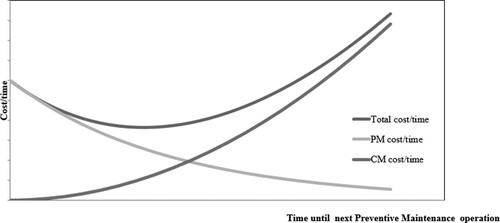
Figure 4. Approach to the total expected cost per unit time function with |T| = 12 periods and η = 2.
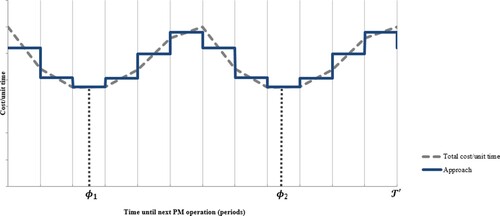
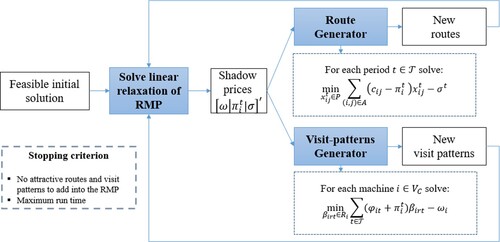
Figure 5. Column generation approach to solve the RM.
Table
Figure 6. Number of times that each customer is considered in a route and the optimal maintenance frequency.
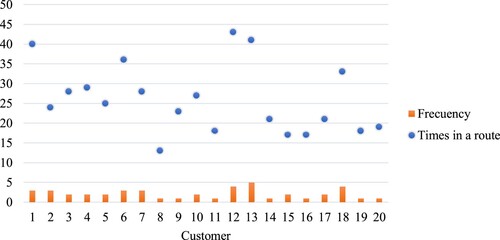
Figure 7. Expected waiting time before CM.
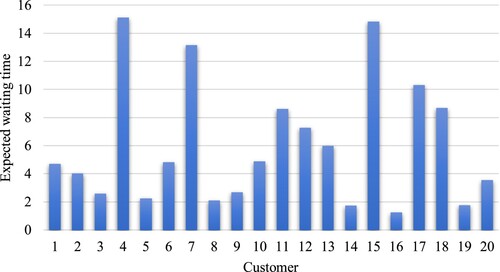
Figure 8. Timer period where each customer is visited (left: 5 time periods, right: 10 time periods).
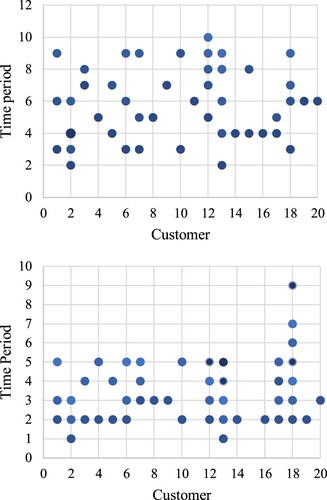
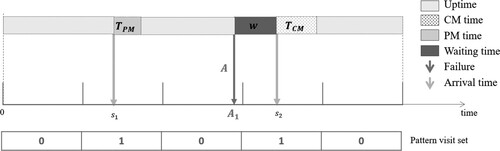
Figure 9. Example of a replication of event simulation of one customer with 5 times periods and a frequency of 2 maintenance operations.
Table
Table 2. Summary of results from event simulation model for each customer .
Table 3. Results with 5, 10, and 20 time periods.
Table 4. Results of Multi-Period Combined Maintenance and Routing model (MP-CMR) and benchmark procedure.
Figure 10. The average of waiting time for T = 5, 10, and 20 periods with (a) 20 customers, (b) 30 customers, and (c) 40 customers.
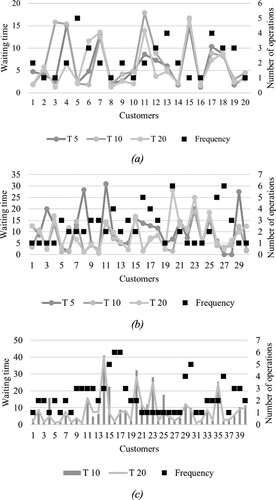
Table 5. Travel time (hours) between pumping stations and maintenance parameters for each plant .
Table 6. Results of Multi-Period Combined Maintenance and Routing model (MP-CMR) and benchmark model on case study with and
.
Table 7. Average of maintenance cost of multi-Period Combined Maintenance and Routing model (MP-CMR) and benchmark model on case study with and
for each plant
.
Data availability statement
Raw data were generated at ARCOSES Research Group. Derived data supporting the findings of this study are available from the corresponding author ELS on request.