
Figures & data
Figure 1. Conceptual model.
Schematic overview of the conceptual model and corresponding hypotheses.
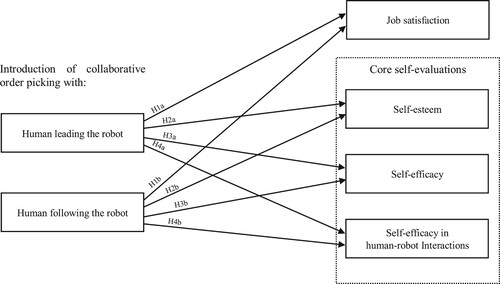
Figure 2. Warehouse lab layout (units in mm).
Schematic layout of the warehouse drawn in cad. Depicts the warehouse racks and sections, the positions of the robots, the quality control station, the standard S-route used in picking, and the dimensions of the warehouse.
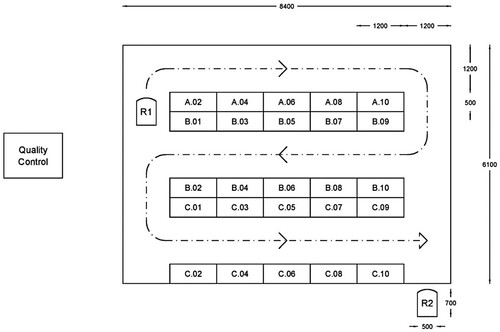
Figure 3. The participant's experimental journey.
Graphic description and summarising of the experimental procedure, as well as the manipulation of the experiment (i.e. the introduction of human–robot collaborative order picking).
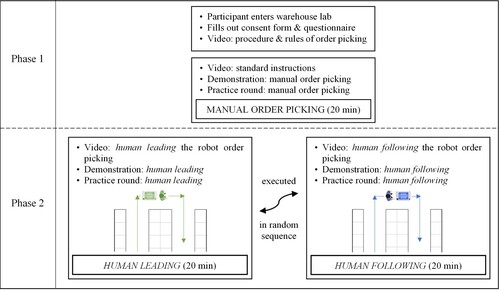
Figure 4. Left: Manual order picking with cart (Phase 1). Middle and Right: human–robot collaborative order picking (Phase 2; human leading and robot following, human following and robot leading).
Compilation of three photos of the order picker performing manual order picking (left), collaborative order picking with the human leading and robot following (middle), collaborative order picking with the human following and robot leading (right).
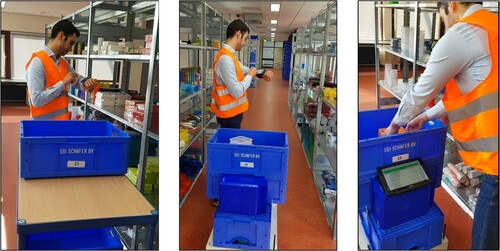
Table 1. Descriptive statistics (mean, standard deviation) and measurement timing of outcome variables.
Table 2. Linear mixed-effects models predicting Job Satisfaction, Self-Esteem, Self-Efficacy, Self-Efficacy in Human–Robot interaction.
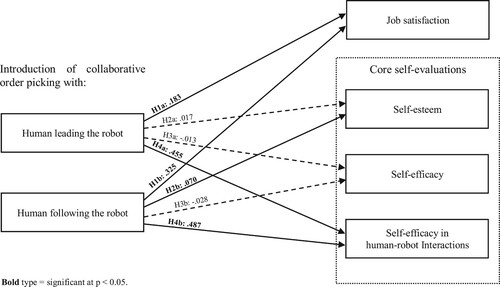
Figure 5. Hypothesis testing results.
Schematic overview of the conceptual model and corresponding hypothesis testing results. Bold type = significant at p < 0.05.
Data availability statement
The data that support the findings of this study are available (anonymized) from the corresponding author, upon reasonable request.